Introducing Laravel Telescope
!Warning: This post is over a year old. I don't always update old posts with new information, so some of this information may be out of date.
Laravel Telescope is a new application debugging assistant from Laravel, written by Mohamed Said and Taylor Otwell. It's open source, free on GitHub, and will be released likely next week.
You'll pull it into your applications as a third-party depedency via Composer.
Once you install Telescope, you'll access it by visiting the /telescope route of your application.
What does Telescope do?
If you've ever used Clockwork or Laravel Debugbar, think those but as a standalone UI, and with superpowers.
Telescope is comprised of a series of watchers that "watch" every request that comes into your application, whether from HTTP requests, from the command line, from a scheduler, or from a queue.
These watchers capture all sorts of information about these requests and their associated data--things like database queries and their execution time, cache hits and misses, events fired, mail sent, and much more.
There are tabs in the UI for inspecting each of the following, which each reflect a "Watcher":
- Requests
- Commands
- Schedule
- Jobs
- Exceptions
- Logs
- Dumps
- Queries
- Models
- Events
- Notifications
- Cache
- Redis
Tabs/watchers
Let's walk through each of these tabs and what the let us inspect. Each of these tabs shows a list page and then allows you to dive into a detail page for any given item.
(HTTP) Requests
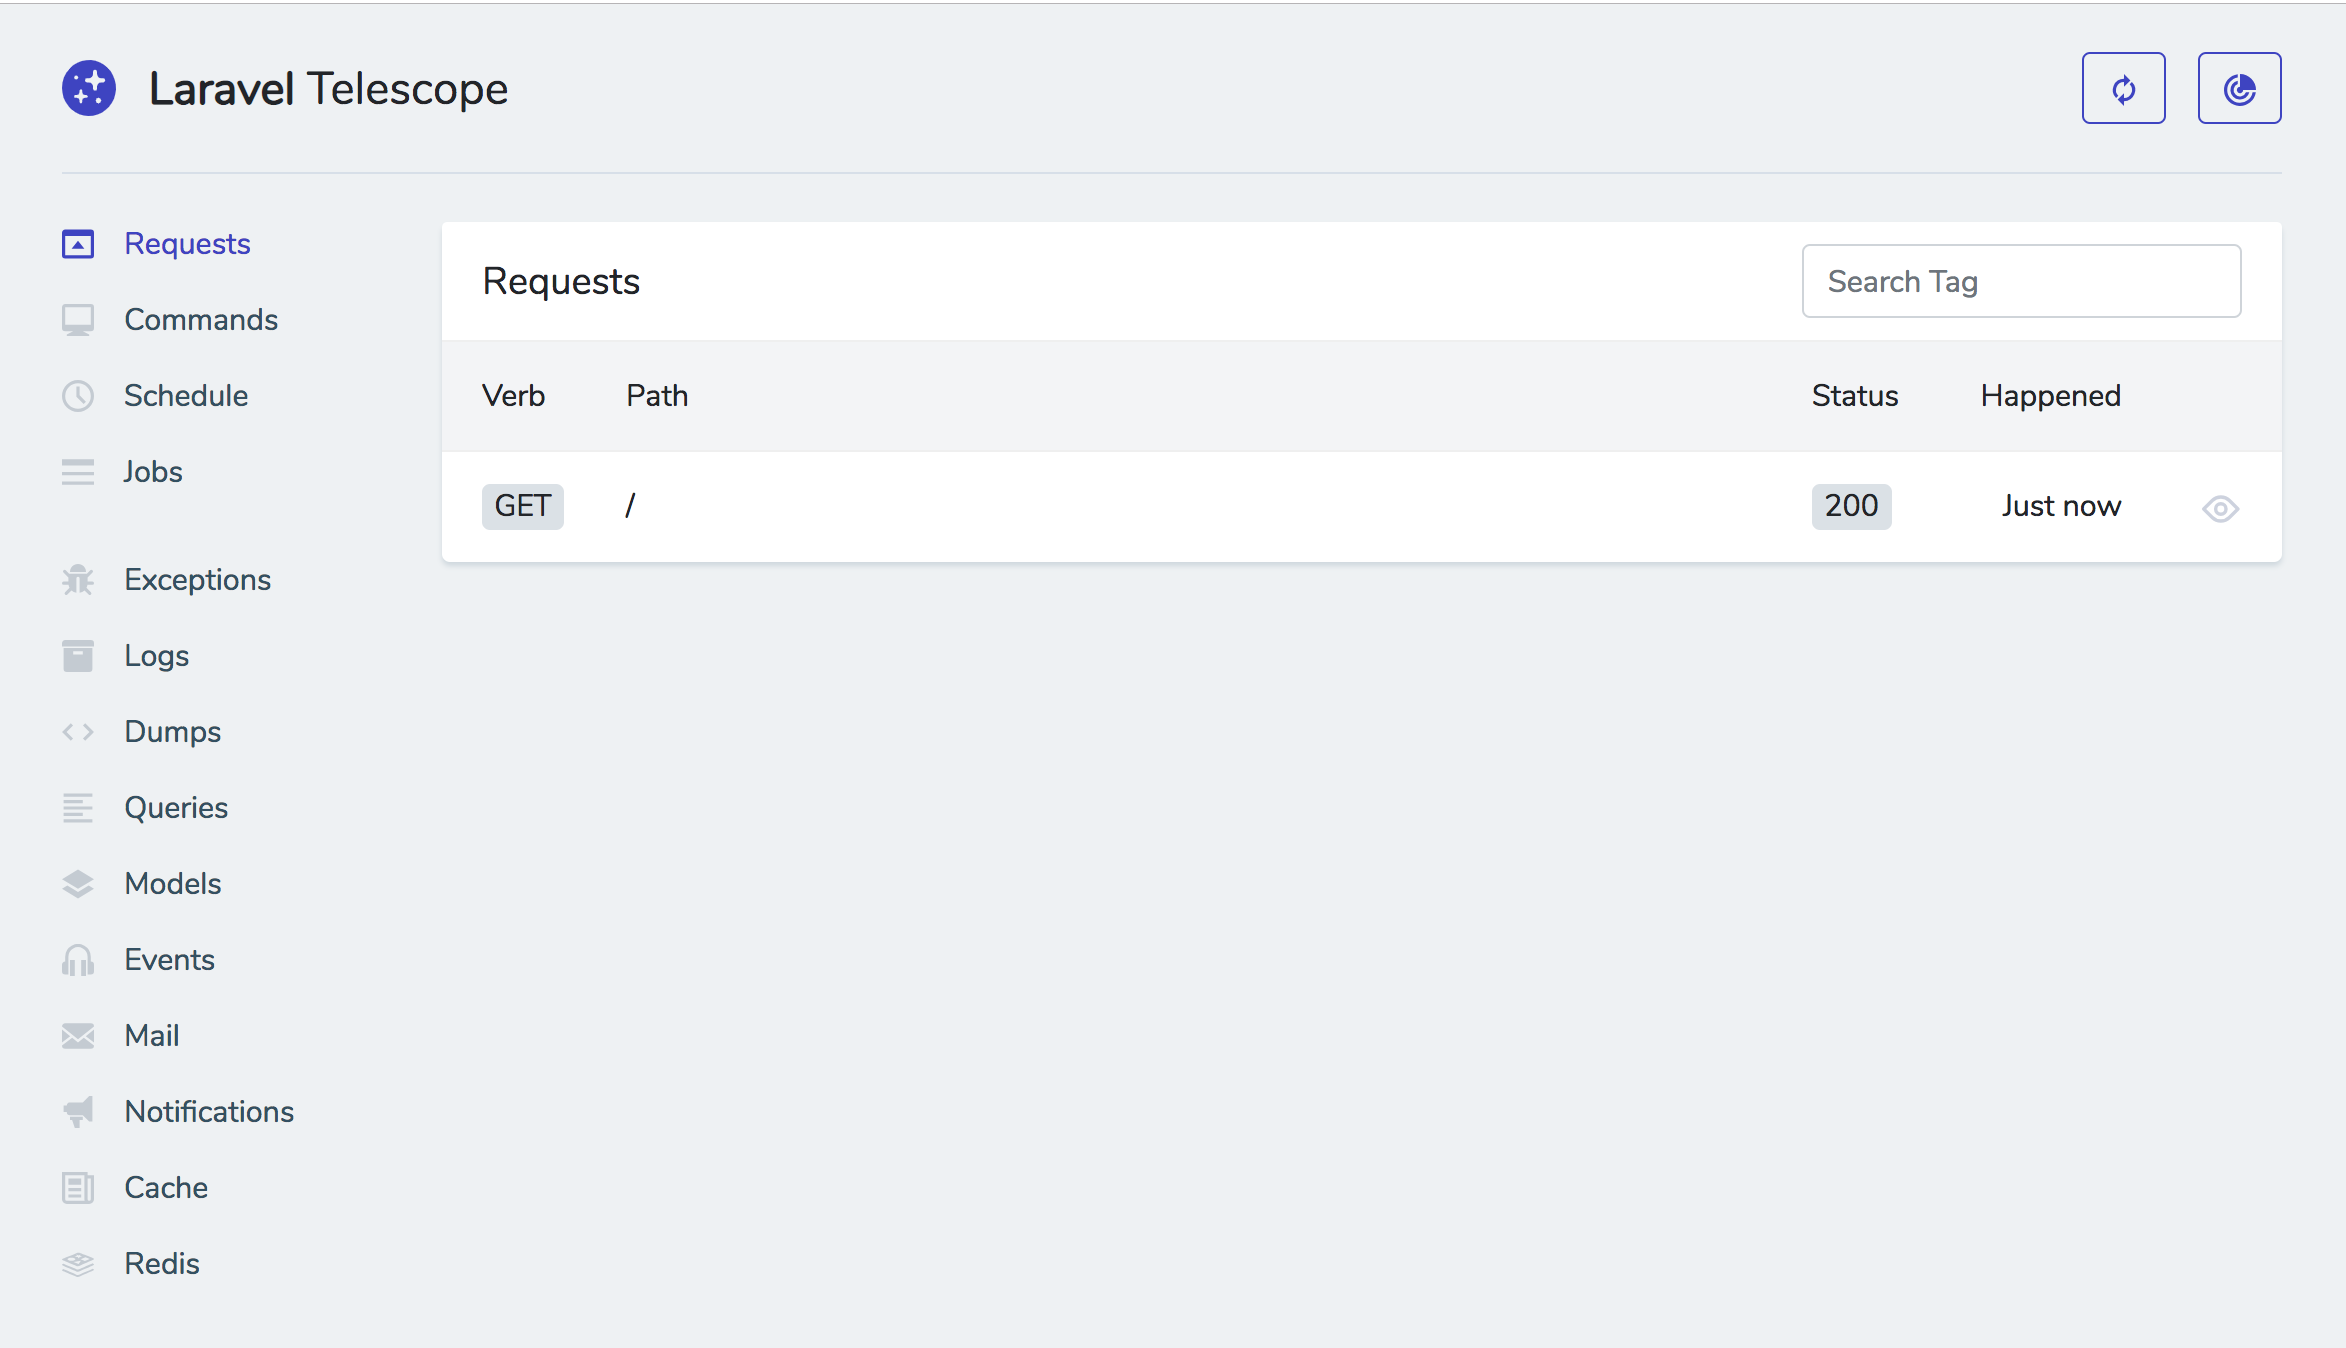
This tab allows you to see all of the HTTP requests that come into your application. You'll be able to inpect all the HTTP requests and all sorts of useful info about each request.
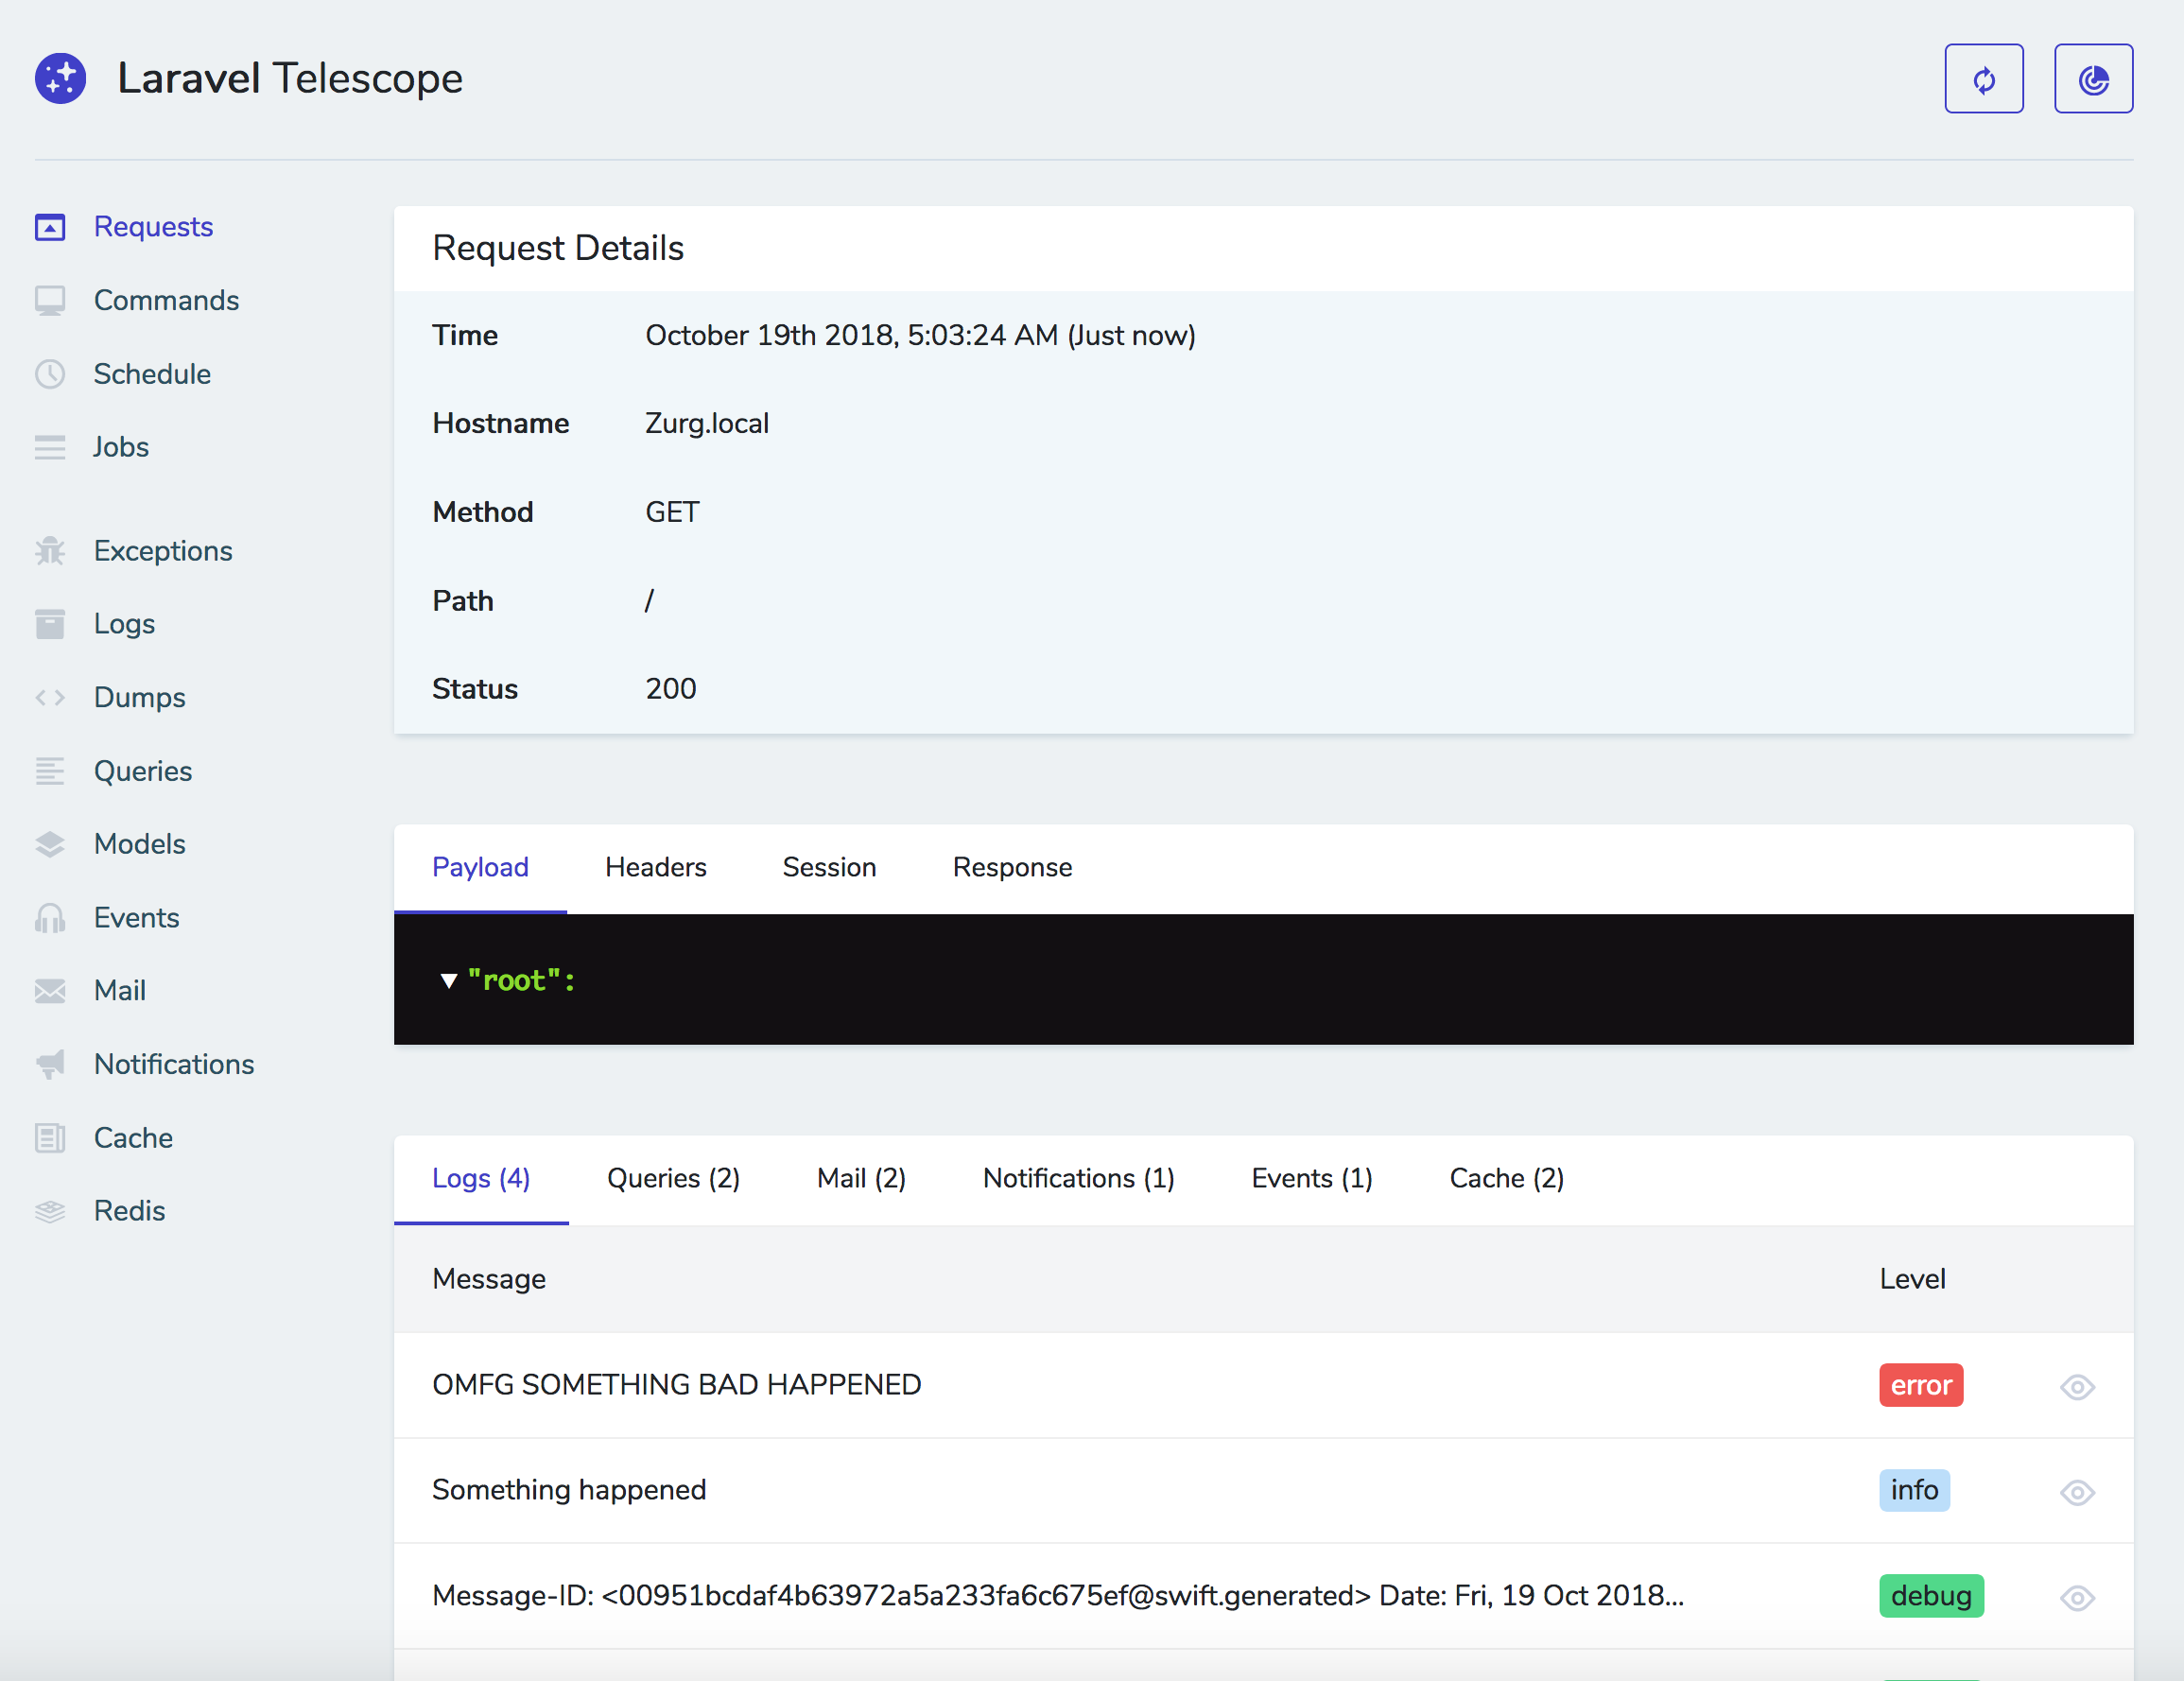
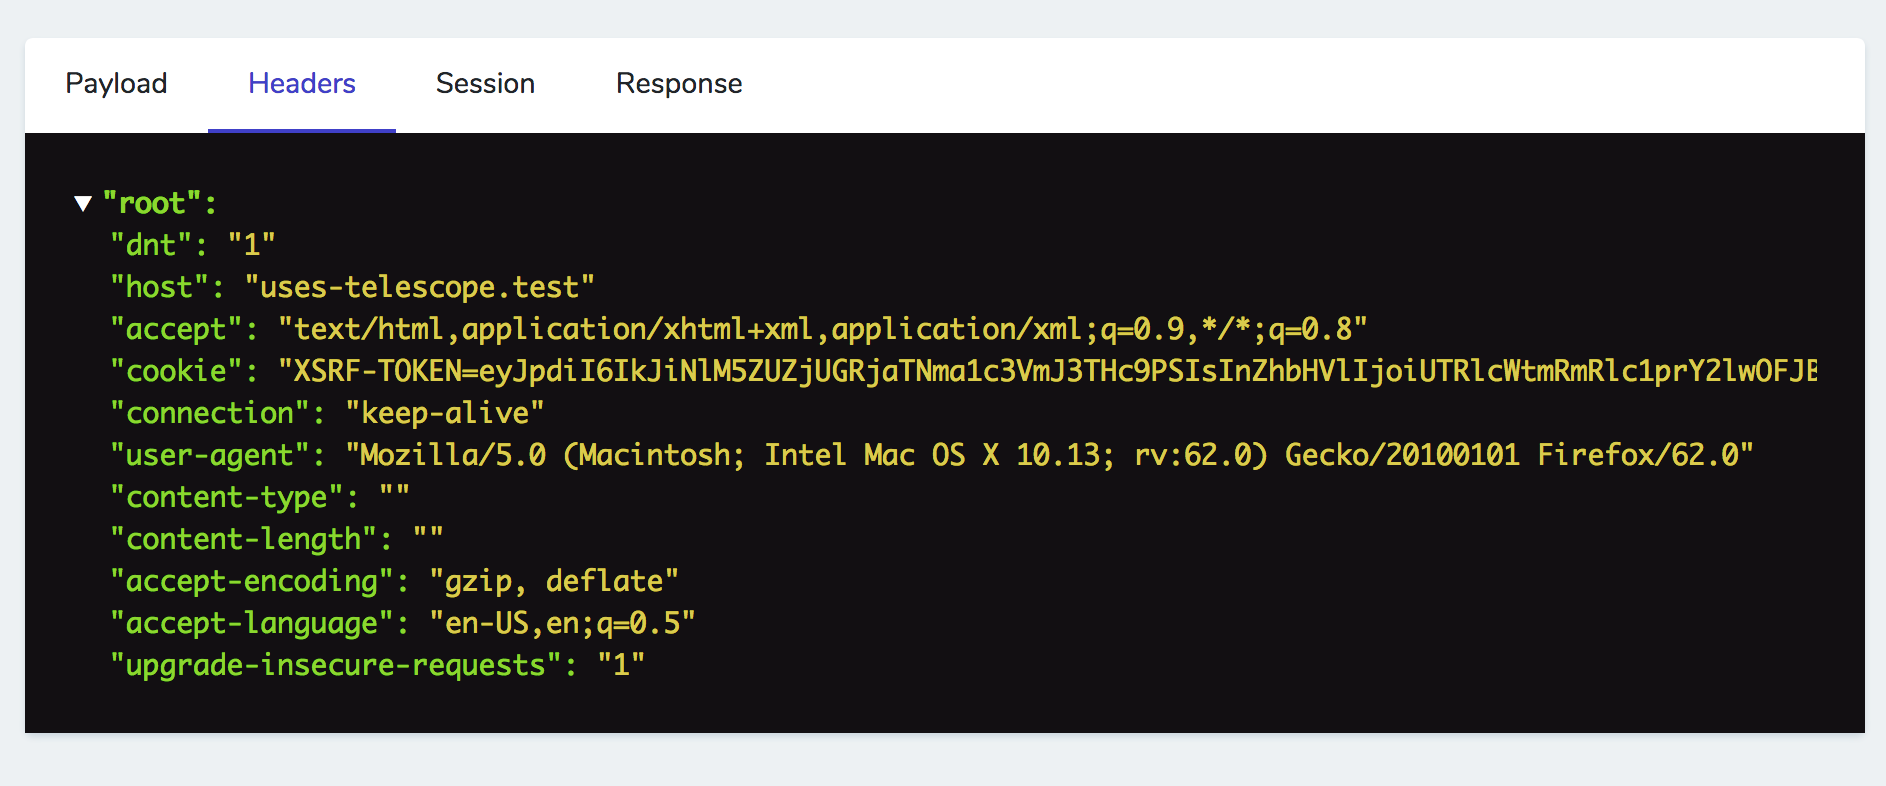

Each request page also shows any data it has from other watchers that are related to this request; for example, all the database queries and how long they took; which user is authenticated for this request; and more.

Commands
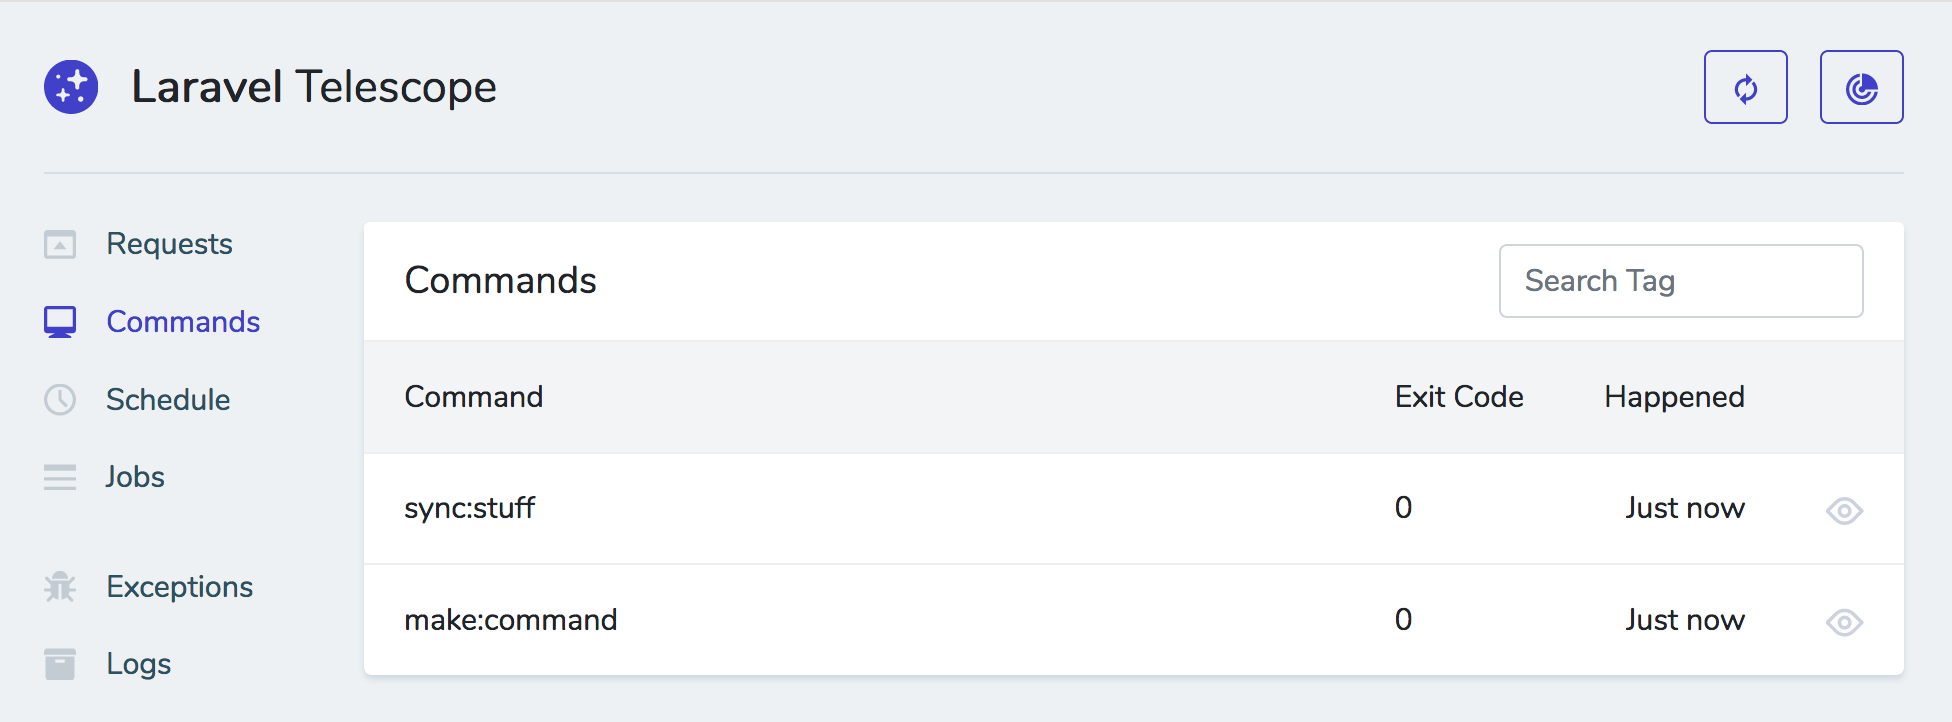
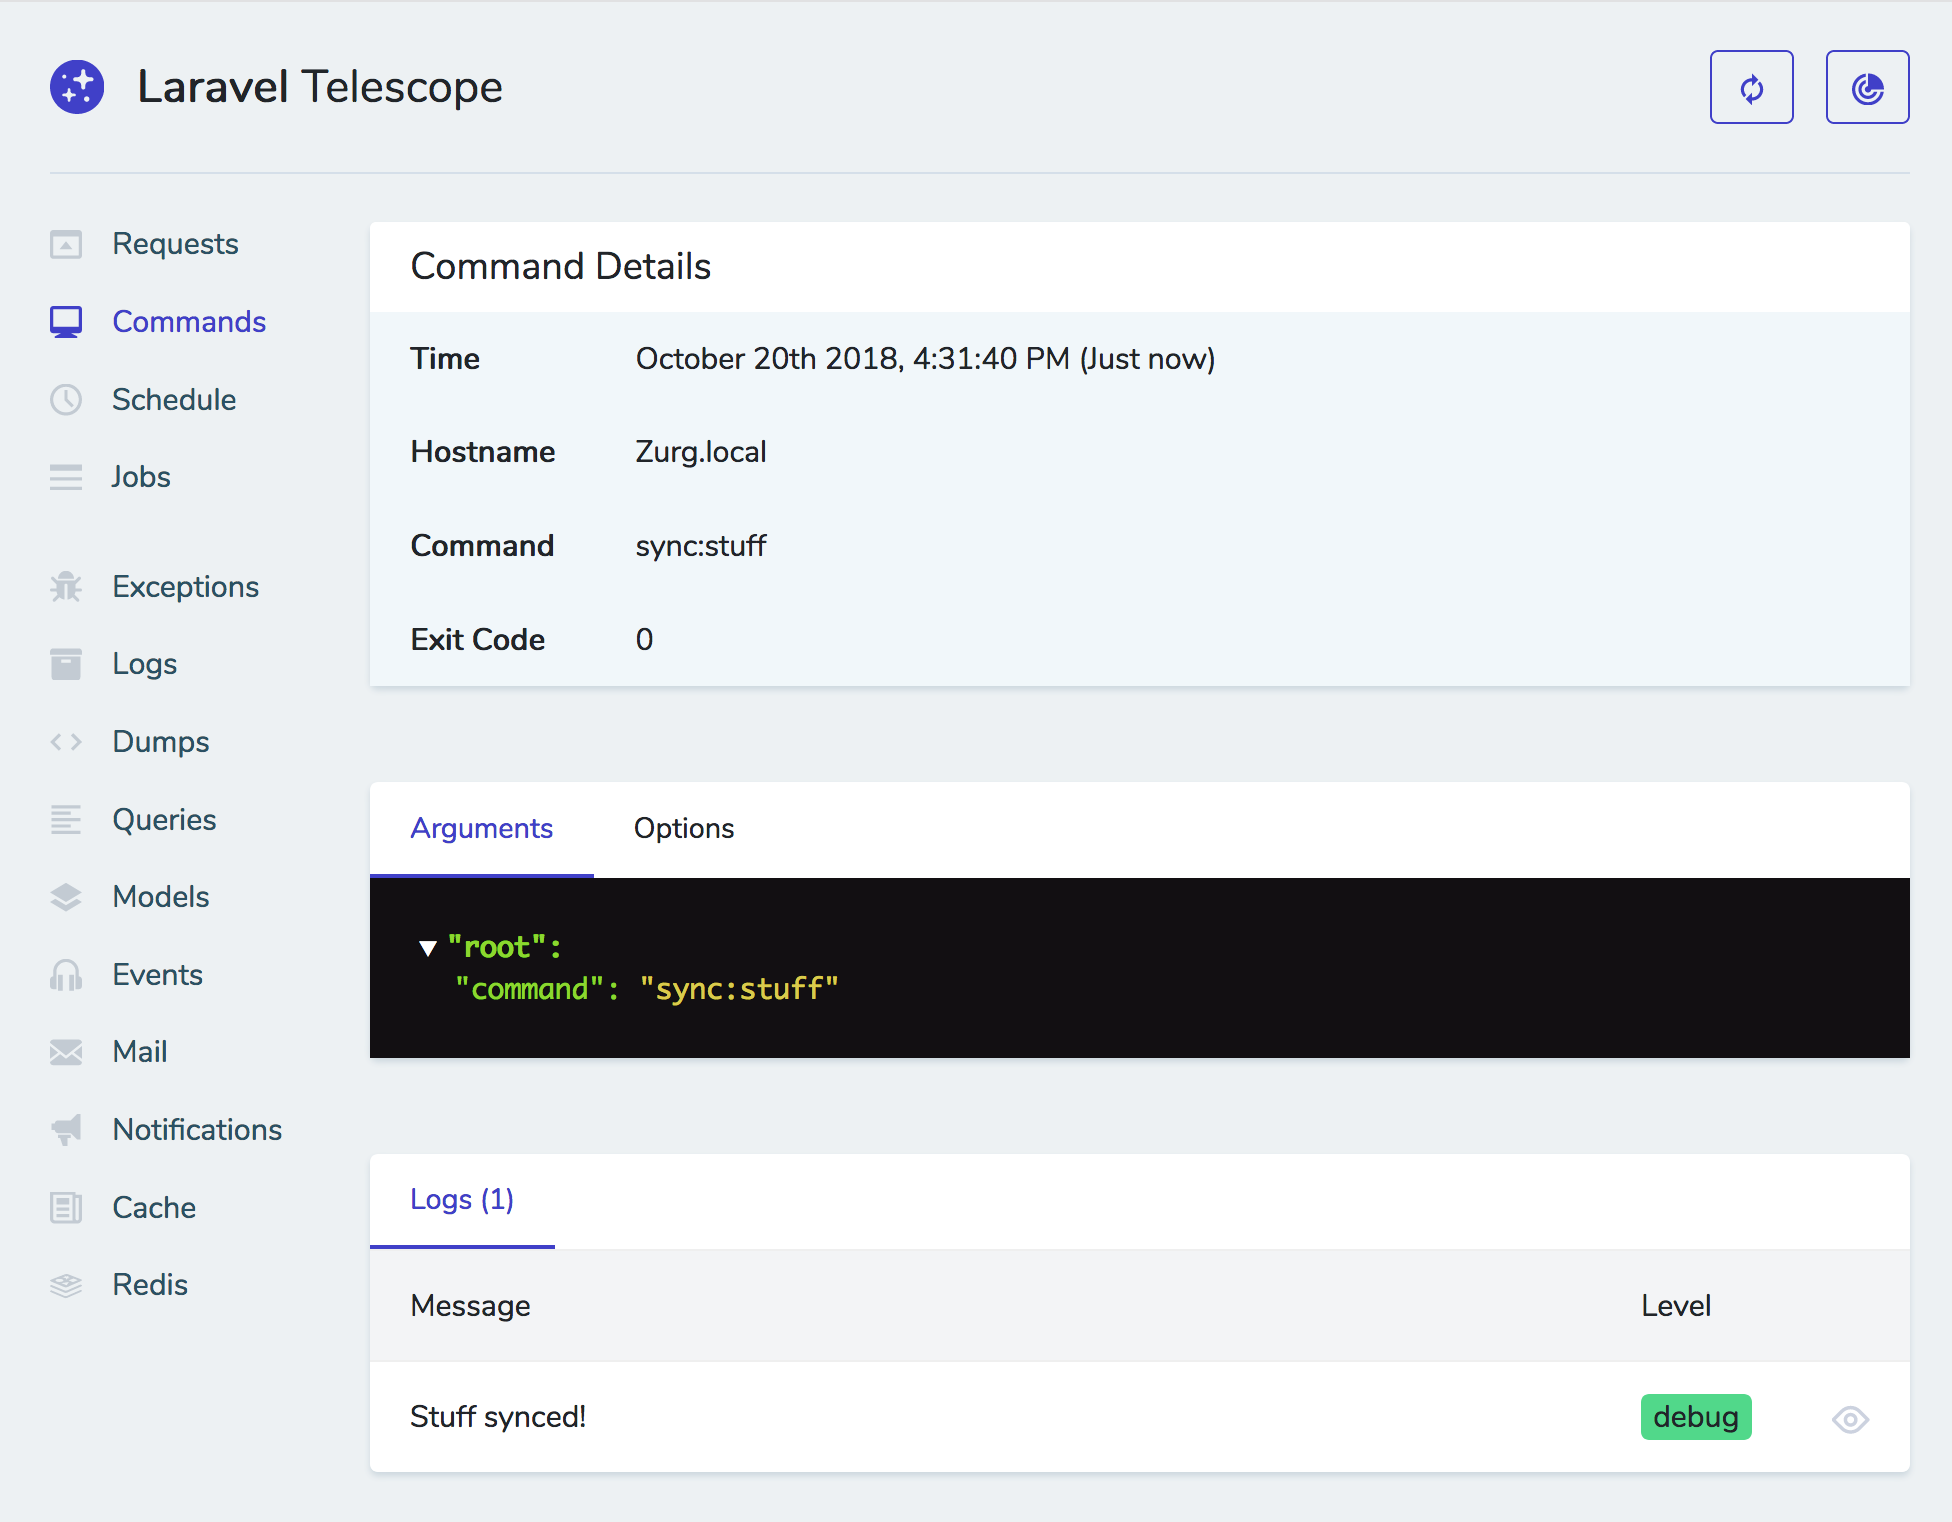
The commands tab lists all the commands that have been run and their exit codes. When you dive in you can also see all of their arguments, options, and related items.
Schedule
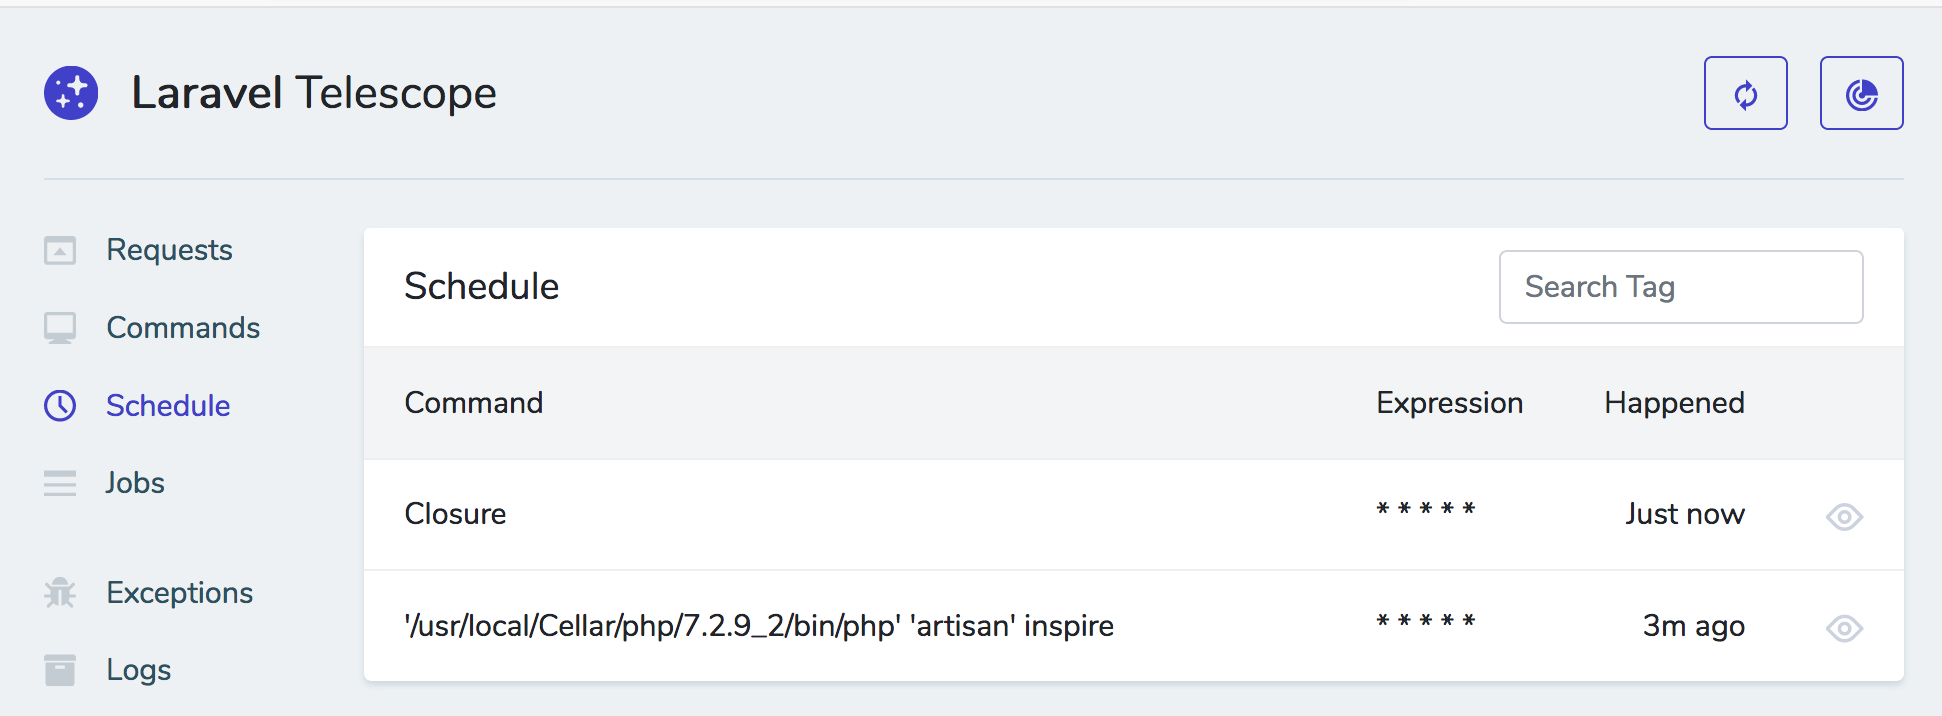
Lists the scheduled tasks that have been run. On each task's detail page, see all of their scheduling information like their cron schedule (e.g. * * * * *).
Jobs
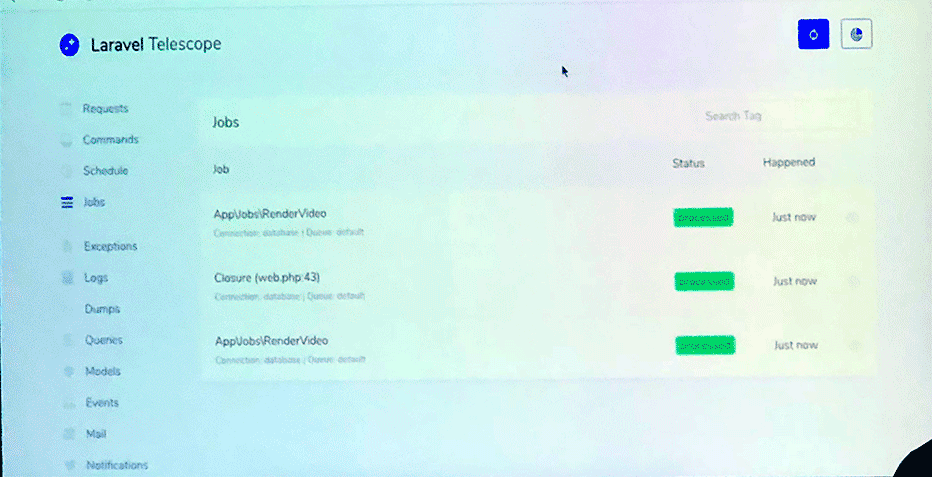
The jobs tab lists out all of the jobs that have run or all running. It's similar to Horizon, but Horizon is Redis-only and isn't just a UI, and it also interacts with how your queue workers are running. Telescope, on the other hand, is just a UI, but it also works for all queue drivers.

On the jobs list page, you'll be able to see the job name, which queue and connection it ran on, its status, and when it happened.
On the job detail page you'll be able to see all of that data and more: hostname, job's fully-qualified class name, connection, queue, # of tries, timeout, tags.
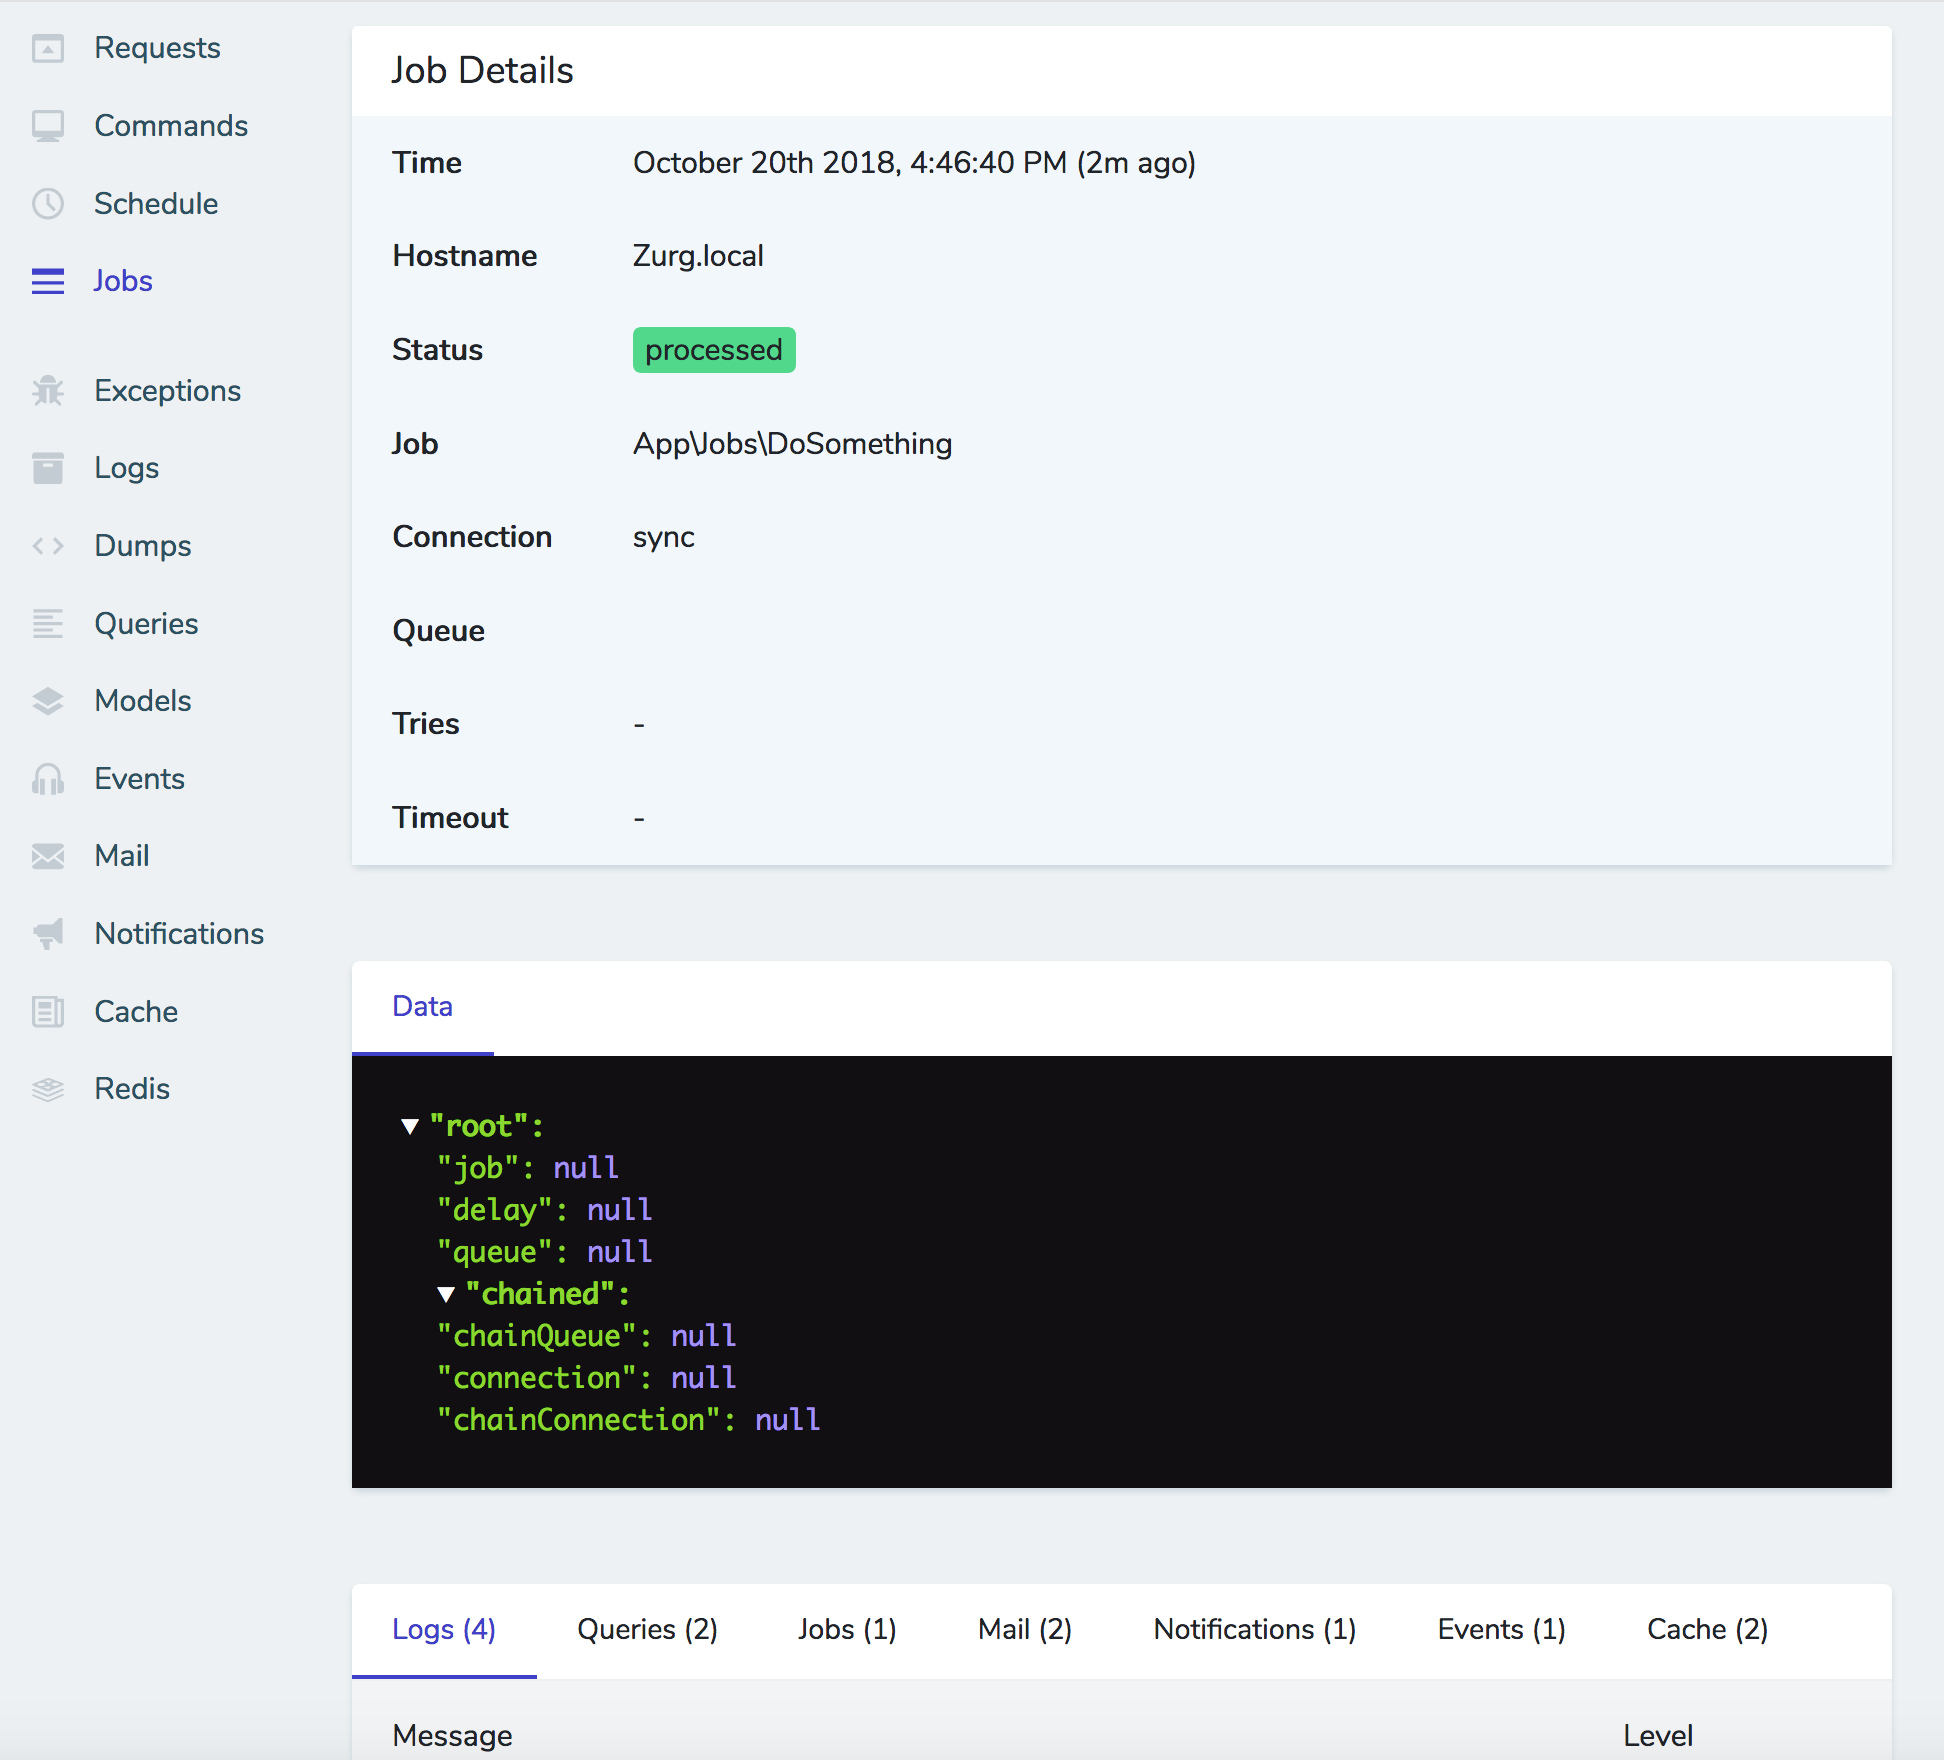
Jobs are auto-tagged with any attached Eloquent models (e.g. App\Video:1), with the user if there's a user attached, etc.
Tags.
Items like requests, commands, etc. will be automatically assigned tags by Telescope (e.g. if it's a request by a user, it gets automatically assigned the tag
Auth:1if User 1; you can click that tag and it'll filter just their tagged items, etc.)
Just like with HTTP requests you can see all sorts of info related to this job like database queries it fired, jobs this job kicked off, and any logs it generated.
If you kick off a closure instead of seeing App\Jobs\RenderVideo you see Closure (web.php:43) showing where it was defined.
New queued closures.
Taylor contributed to a new library to bring back queued closures, which Laravel used to have but went away a while ago. With these contributiosn and this new library, if you
usea model to import it into your closure, it'll store the model ID, not the entire model, which is much better (and what queue classes already do). So, queue closures are back!dispatch(function () use ($video) { // do stuff in a queued job });This will serialize the closure with a hash along with it; this is because with queueing closures, someone could previously modify your queue event to inject anby arbitrary PHP to be run through it, which is not good! Now it hashes it and checks your code agains the hash.
Closure is serialized as a long string which includes the entire code and a hash of it (uses code similar to the signed URLs).
Exceptions
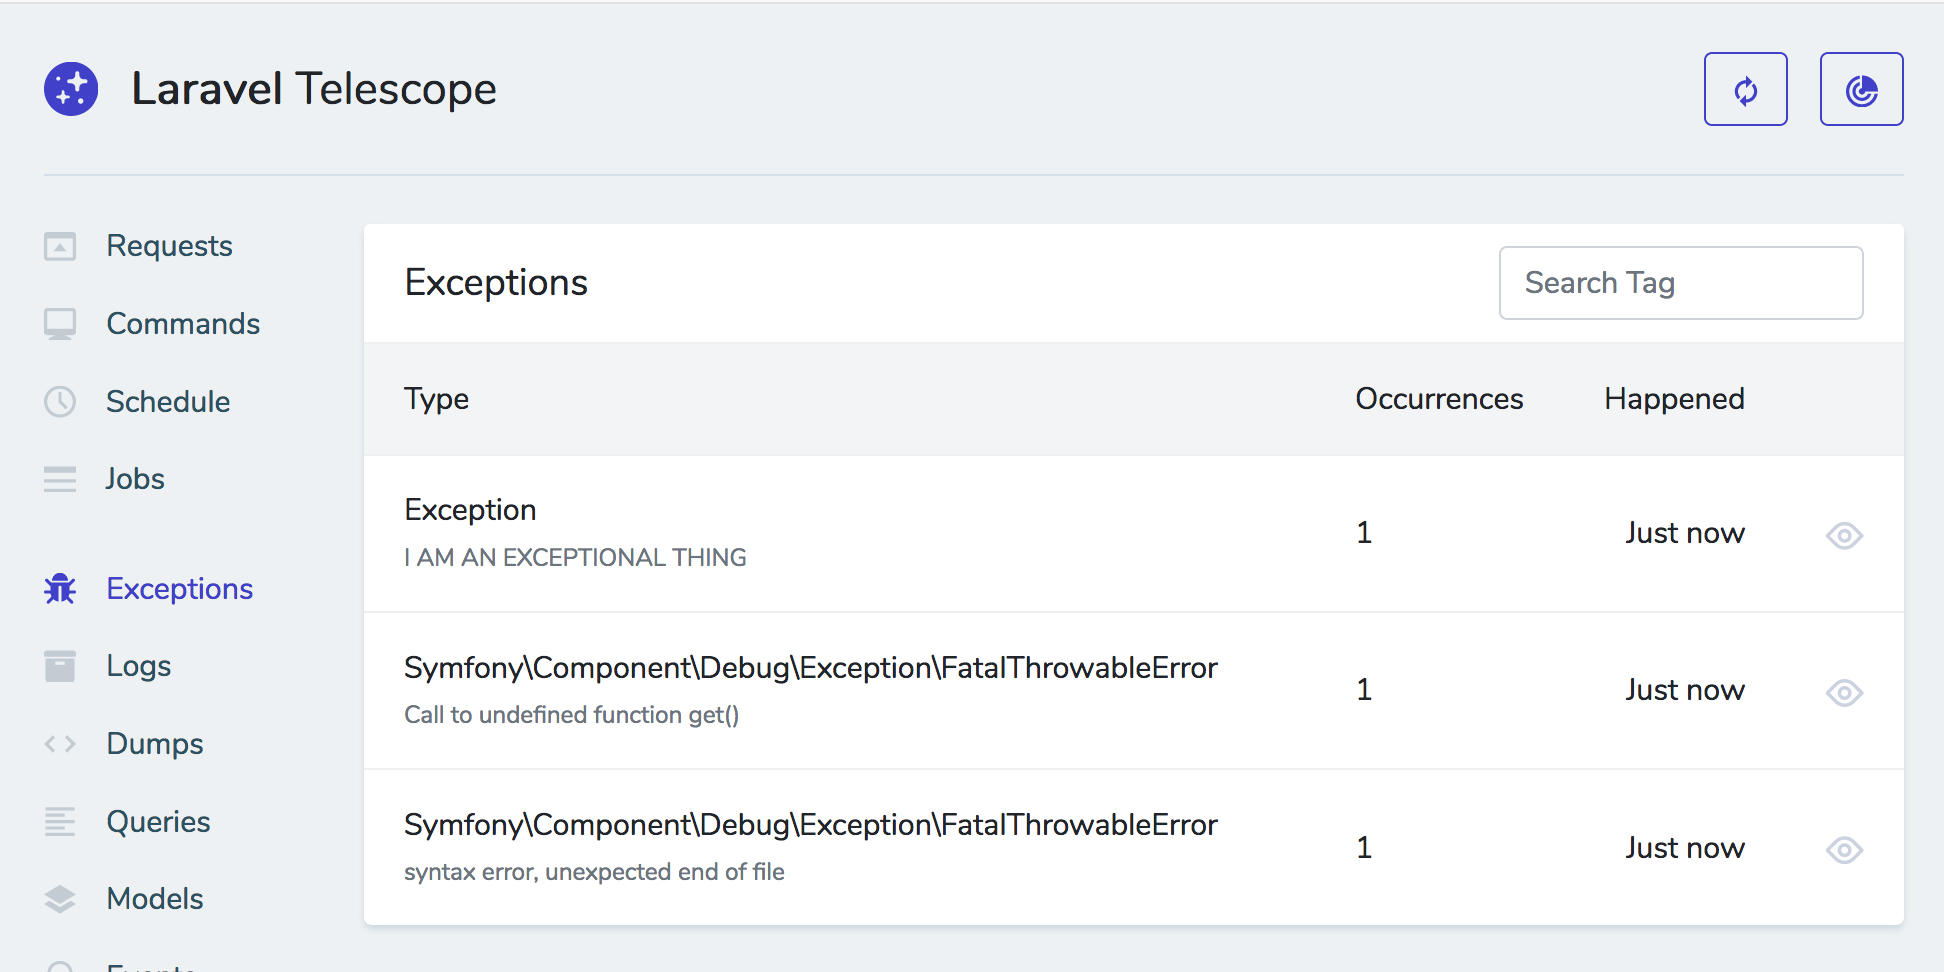
Logs all exceptions and allows you to inspect each. This will show you similar data to the other tabs, like hostname, type, request, tags, authenticated user.
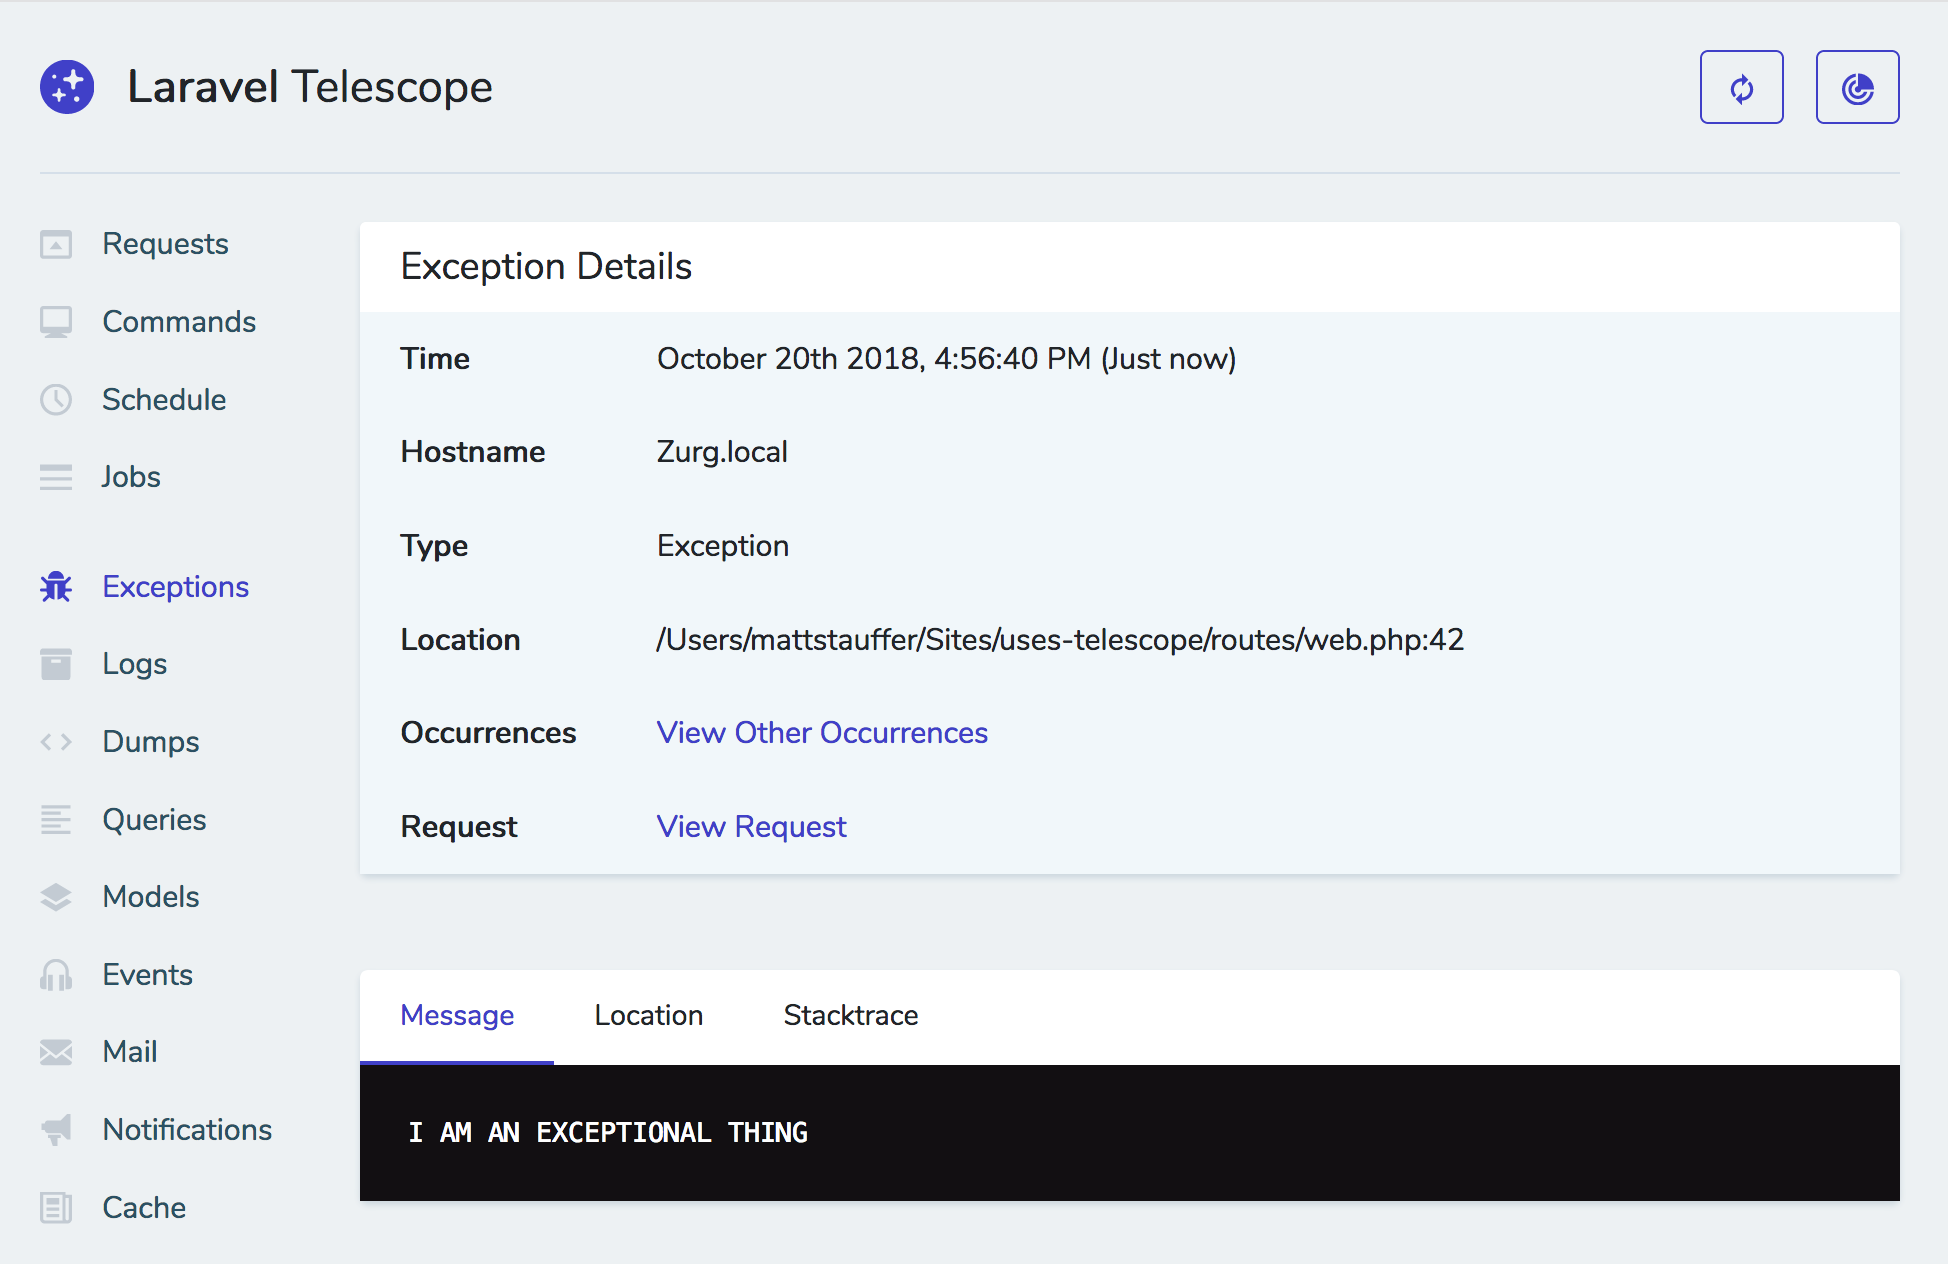
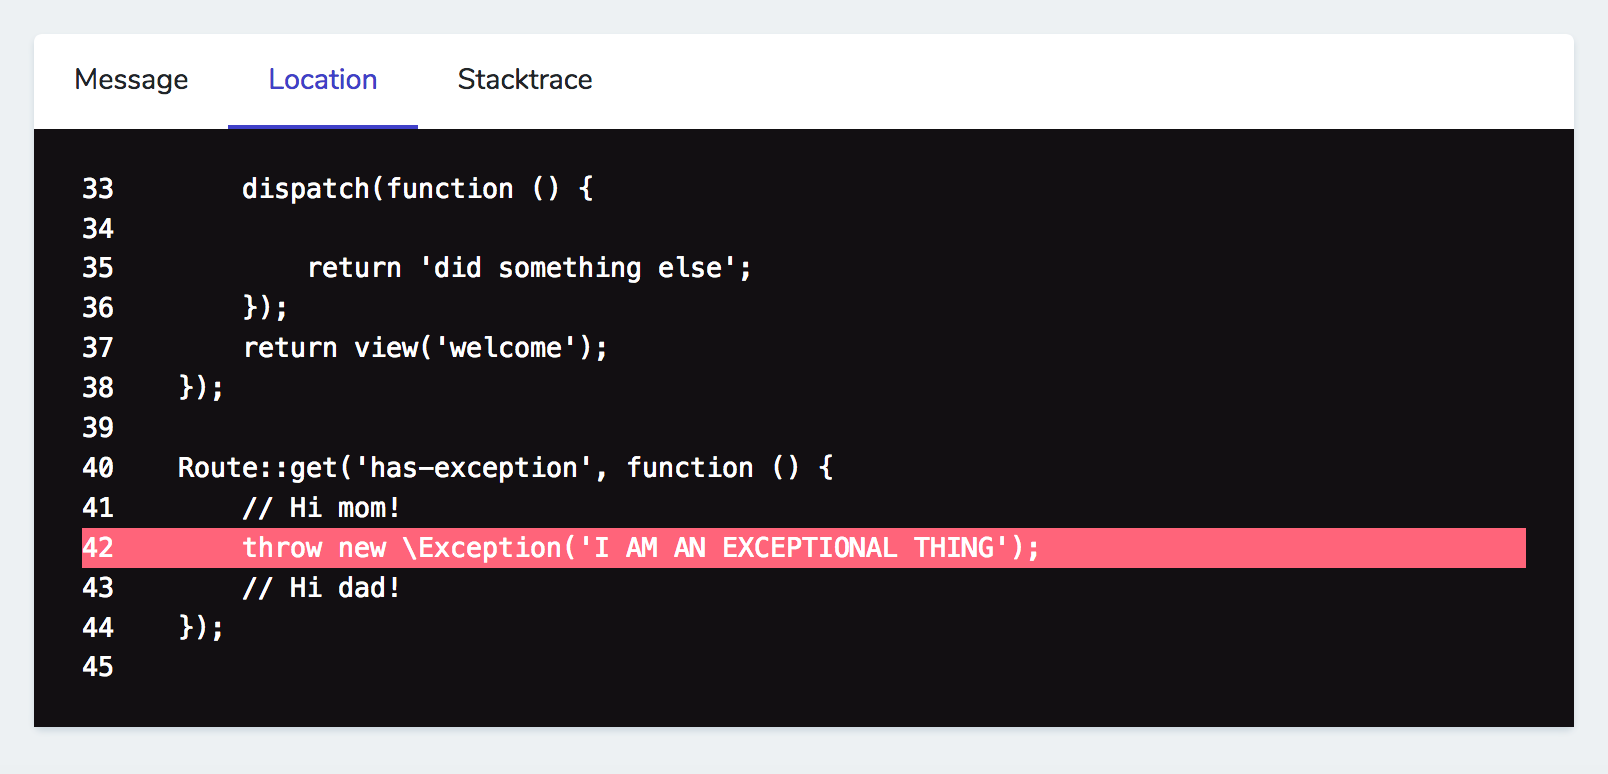
But you'll also see the location within the code, highlighted, with a few lines of code above and below it; and you'll also get a full stack trace.
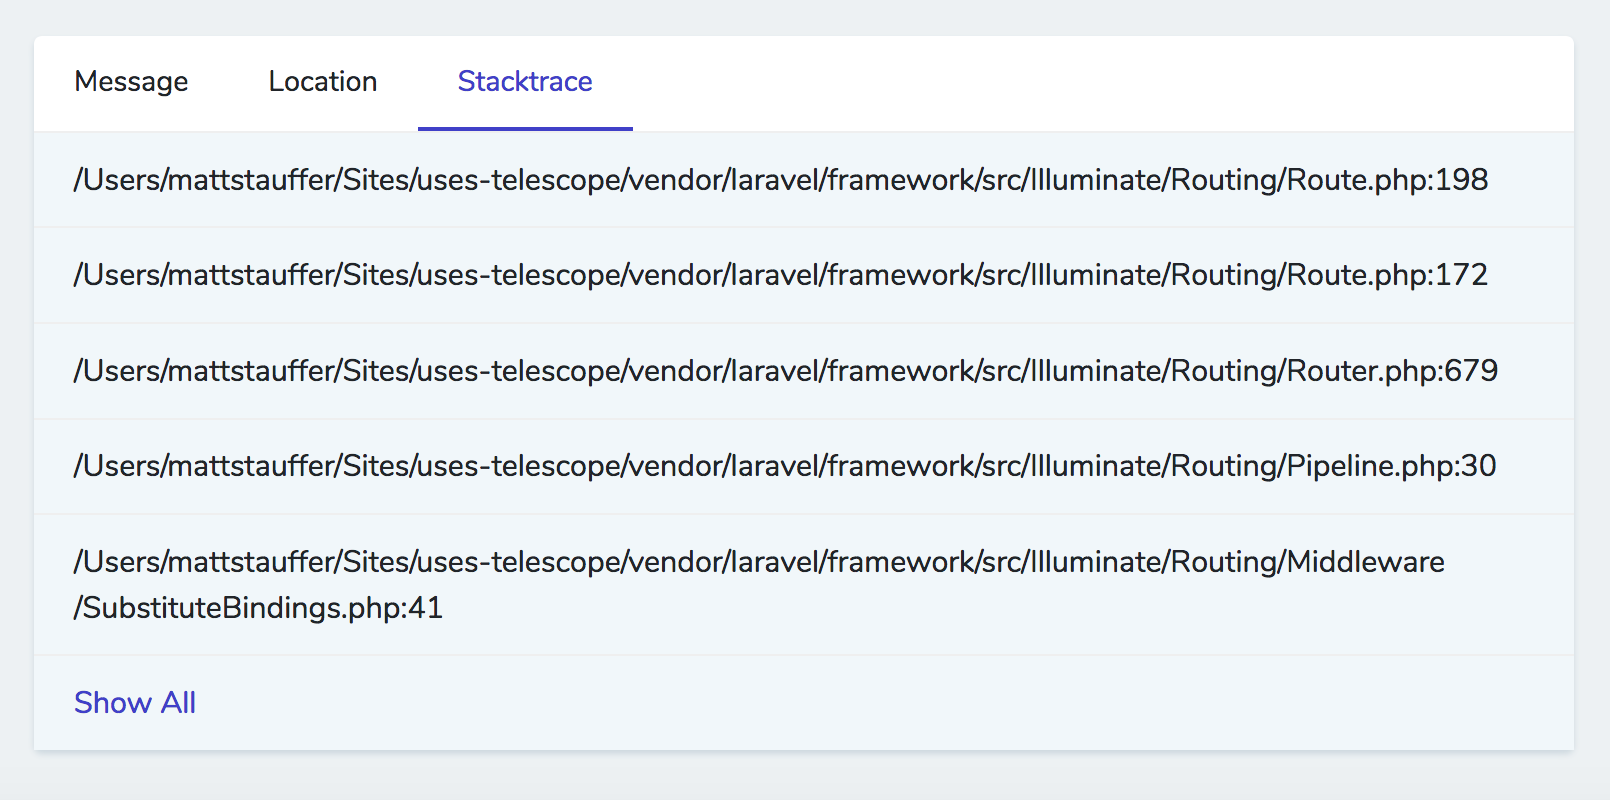
You can also get a link to an exception detail page from the request in which it was thrown.
NOTE: In many tabs, if you're on an individual page (e.g. the page for a given exception) you will get a link to the request page that generated that one
If the same exception happens multiple times, they'll get grouped on the list page, but you can still drill down to individual exceptions from the exception show page.
Logs
The logs tab shows you the basic log message, level, and when it happened for all log items.
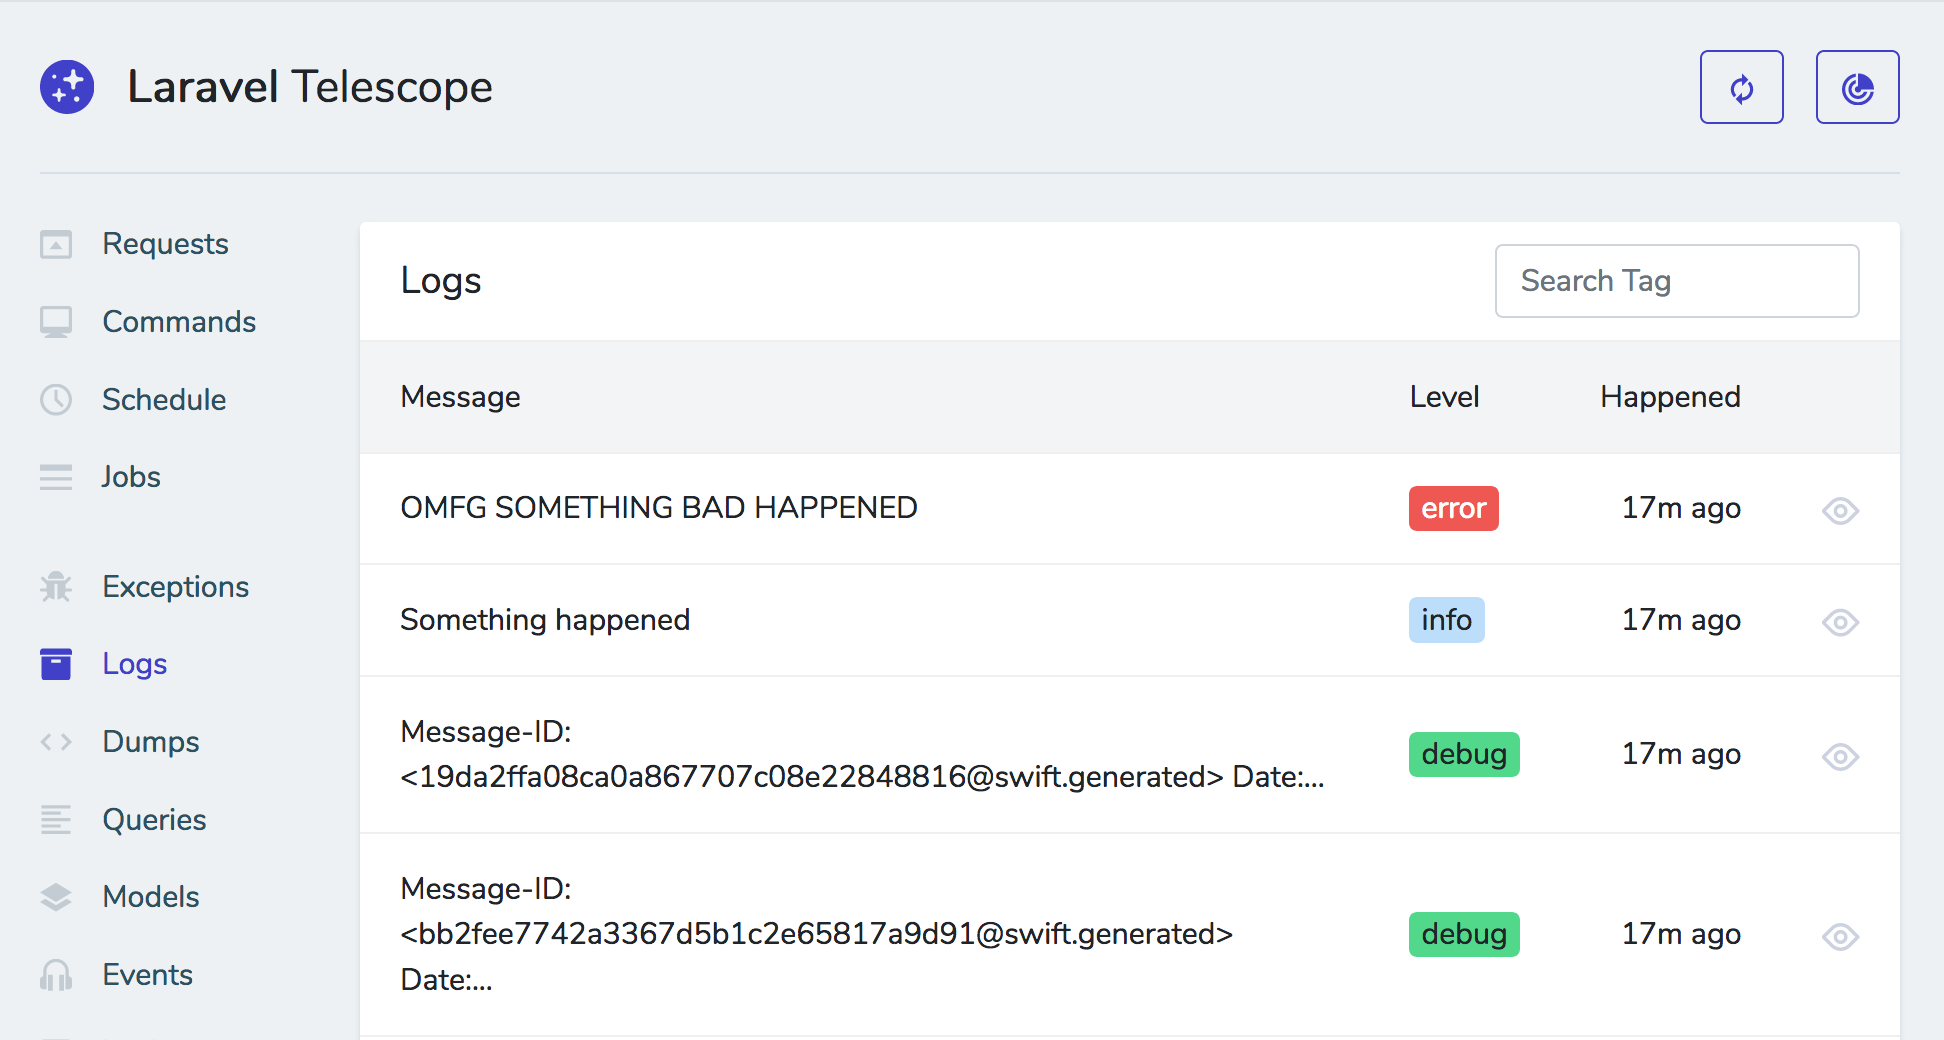
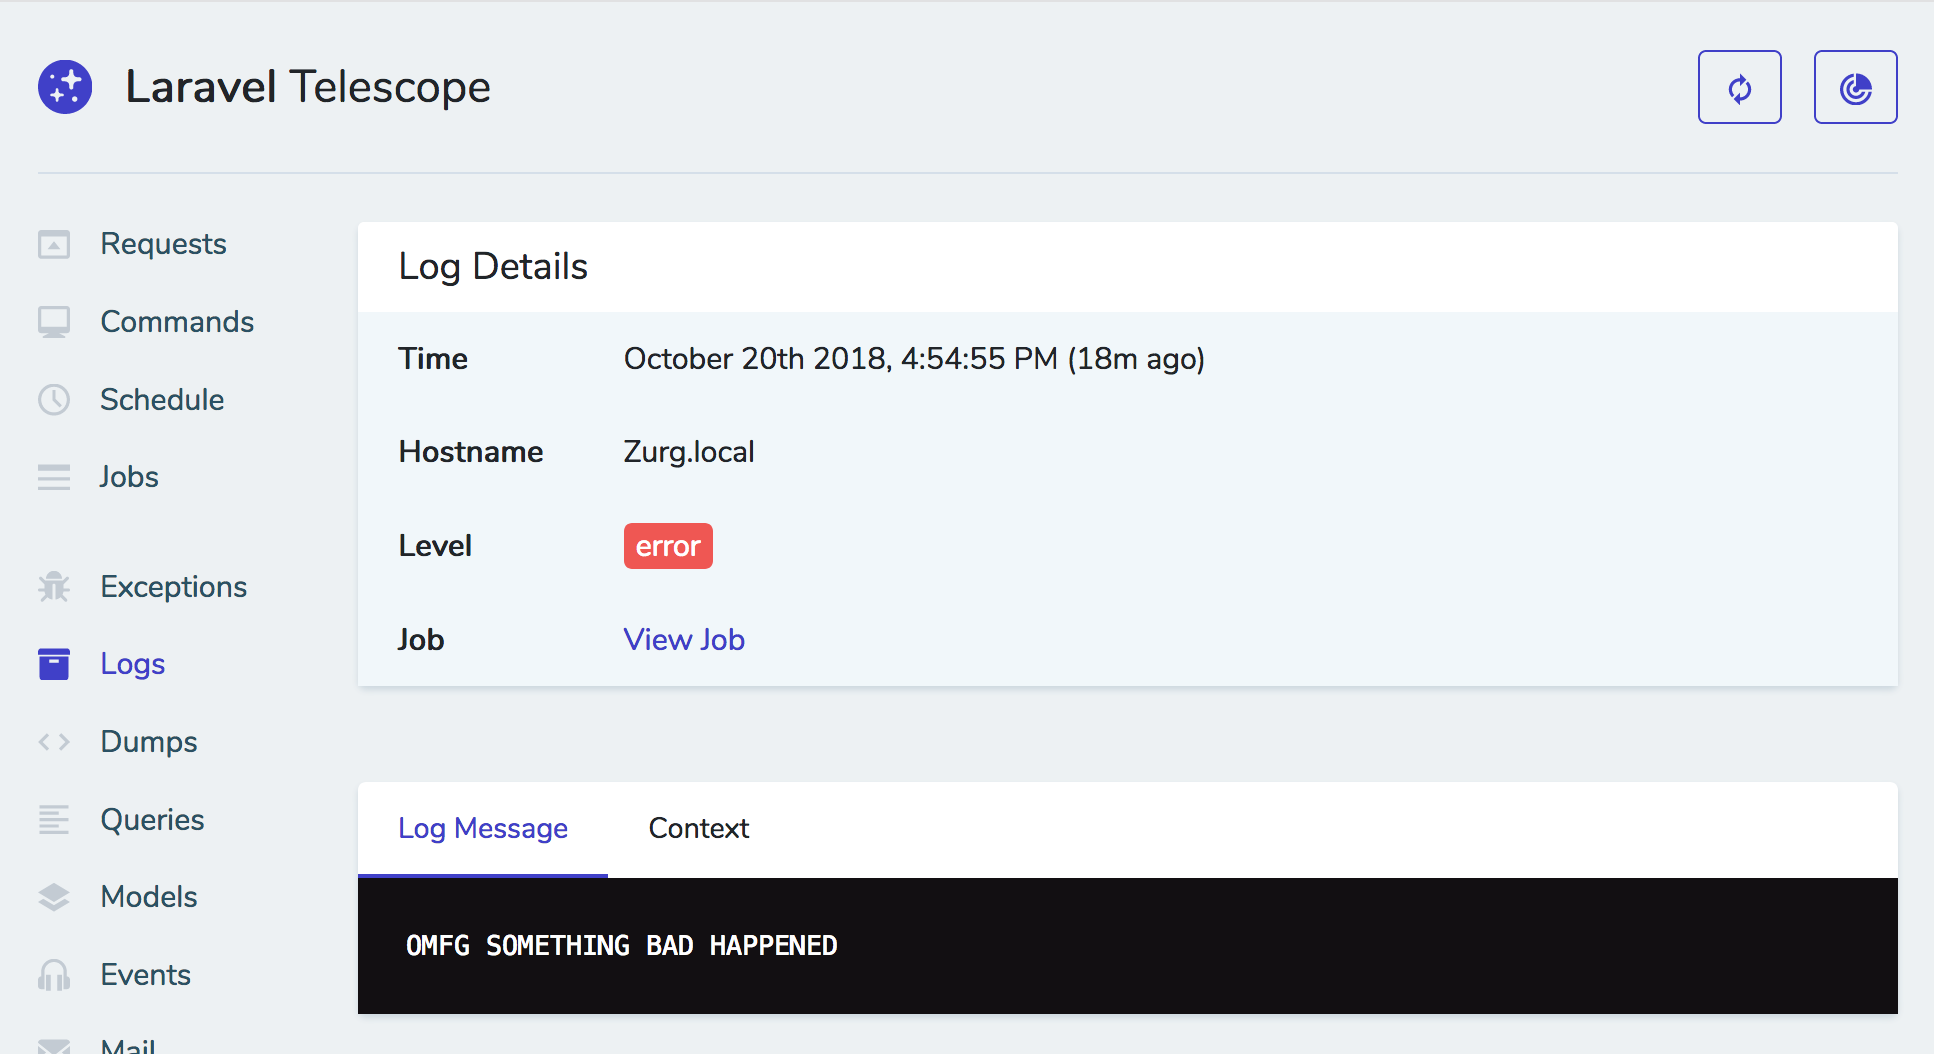
When you visit the individual detail page for the log item, you can see more information including any context data you passed to the log items (as an array).
"A little nicer than digging through raw text files".
If you pass context to your log items with the array , you can see all that data, see the request that triggered it, which user triggered it. "A little nicer than digging through raw text files."
Dump screen
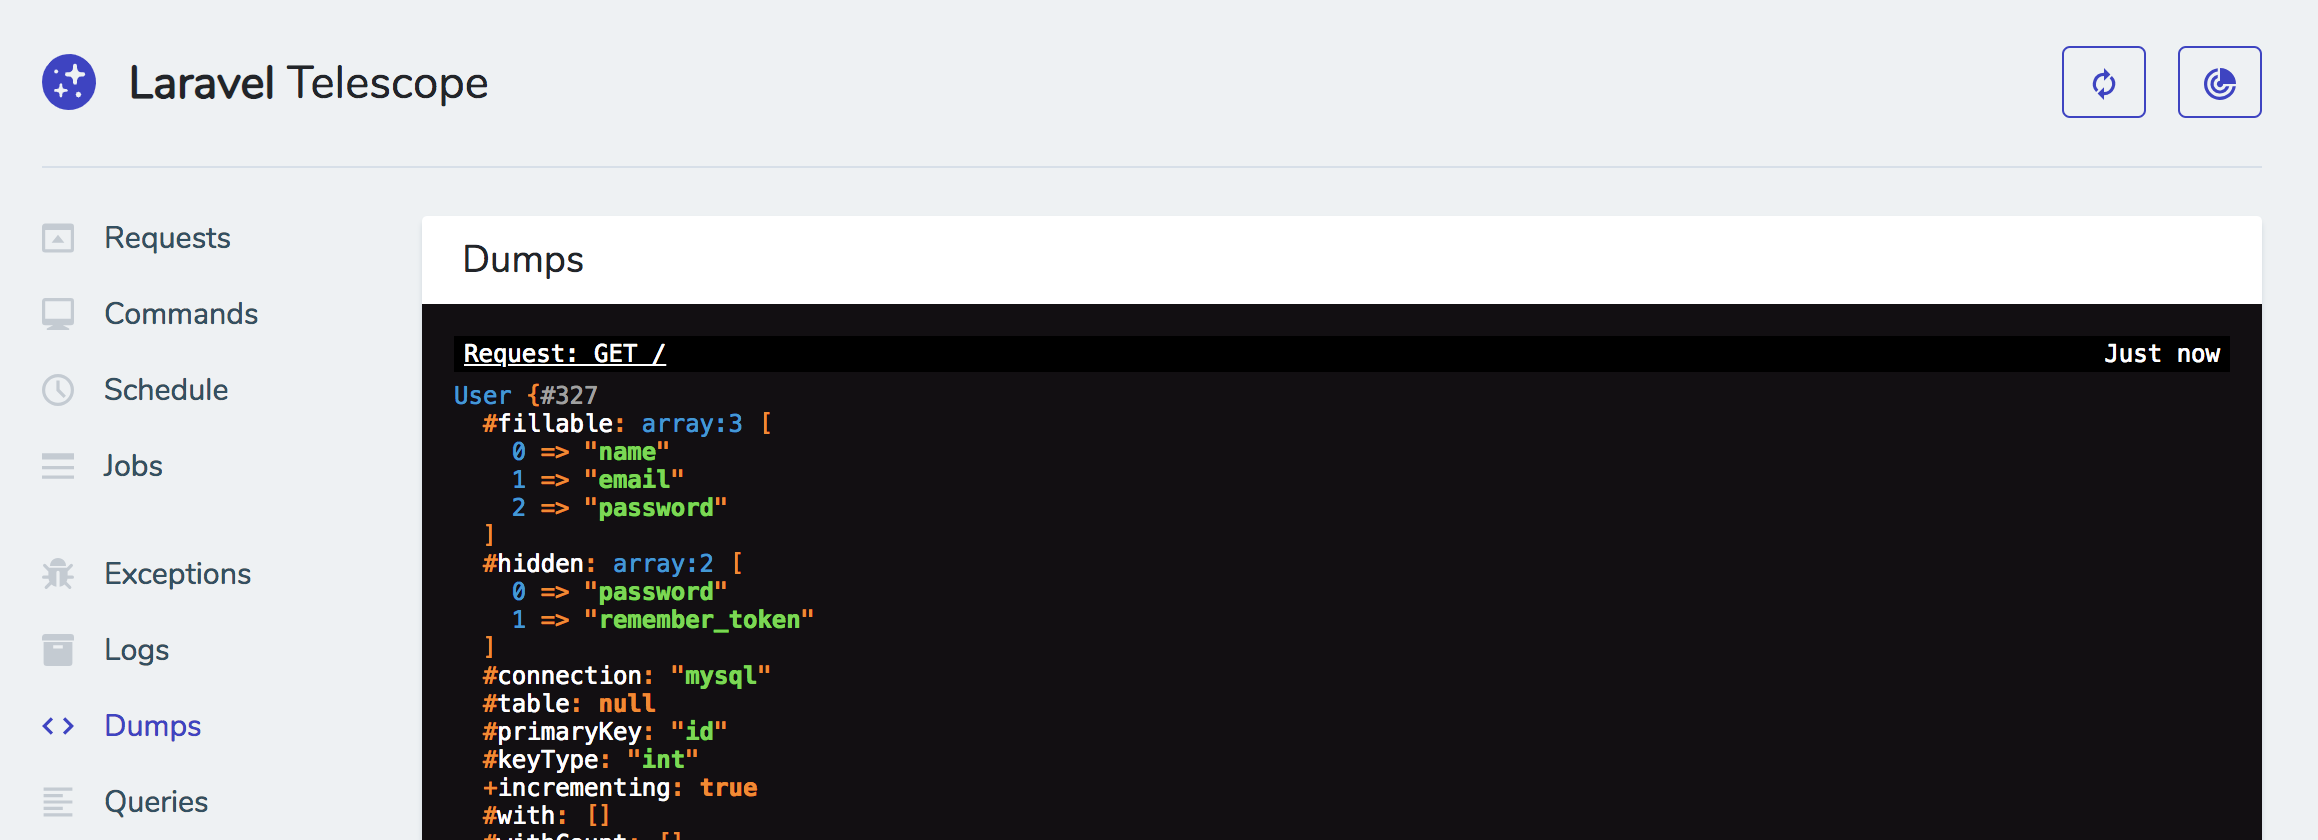
"This is one of my favorite features"
If you use the dump() method in your code, and you have it this dump screen open in Telescope, you'll see the dumps in Telescope but not your actual application. This gives you dd() style output of your data without it messing up your normal page load. Each dump also links to the request which generated it.
If you leave the dump screen, all of a sudden your dumps show up in your browser again.
Queries
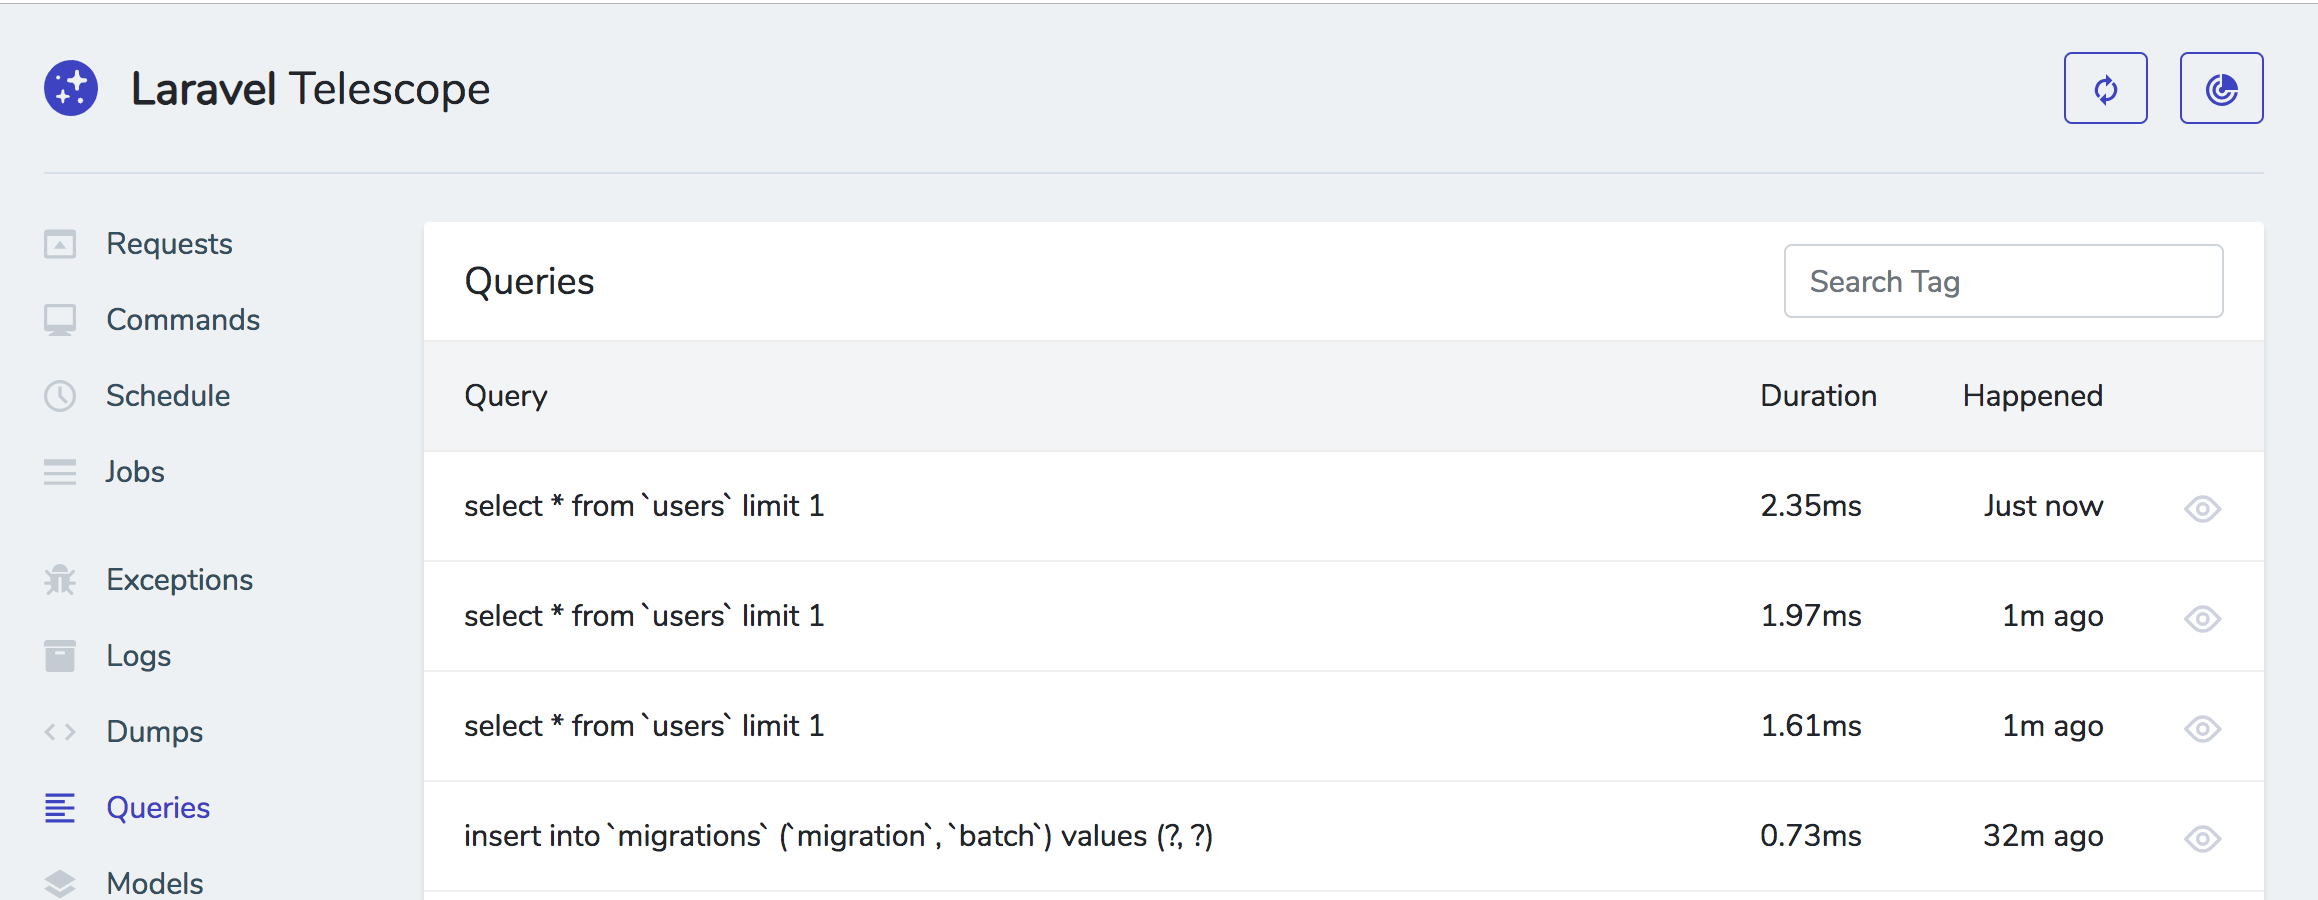
List of all your DB queries--like the debug bar. How long they took, jump in and view the full query, which request triggered it, etc.
Nice formatted view.
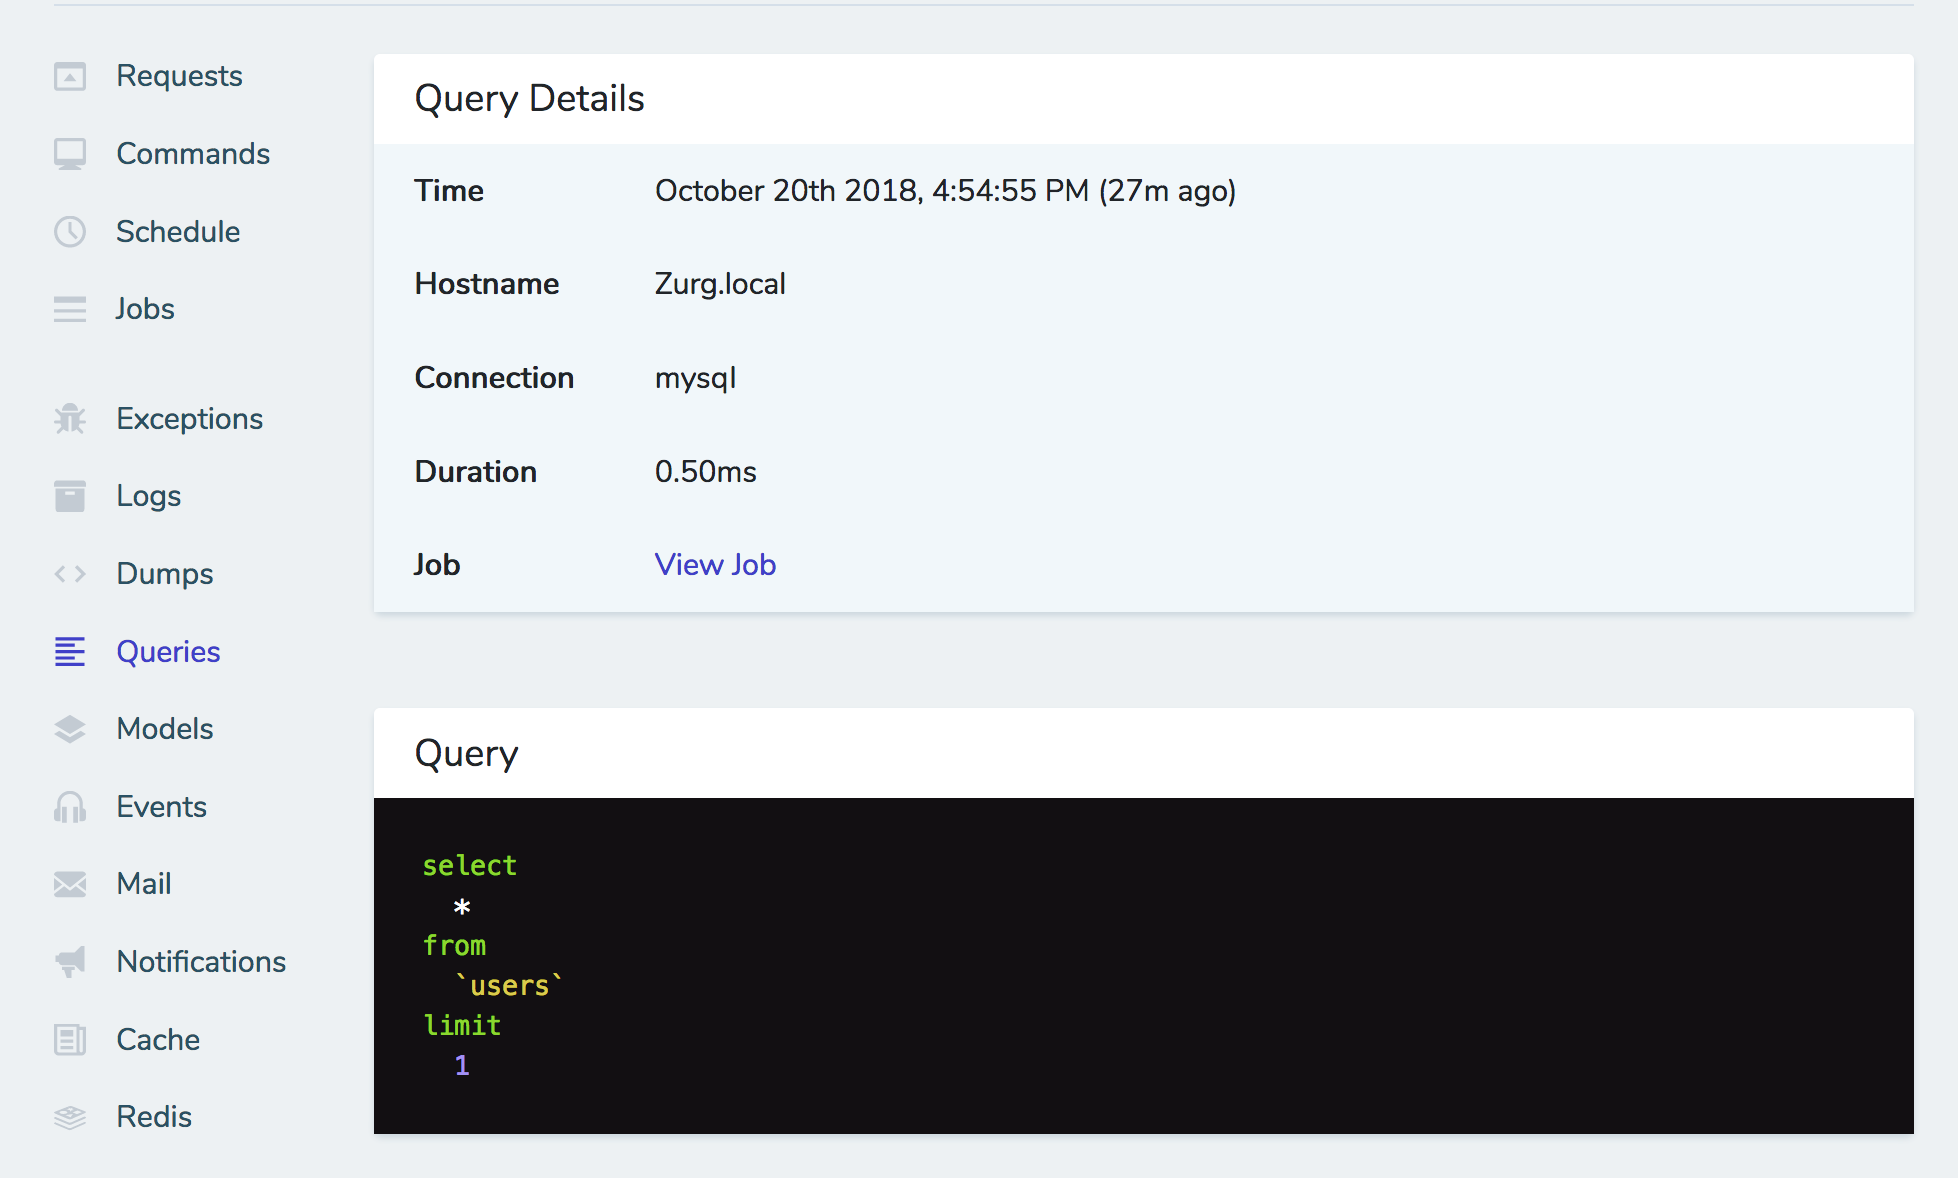
Can set a boundary for what makes a query "slow" in your service provider; once something takes longer than that it's tagged as slow and also marked as red in the list page.
NOTE: Super slick and fast search on every list page. Searches tags and other stuff.
Models

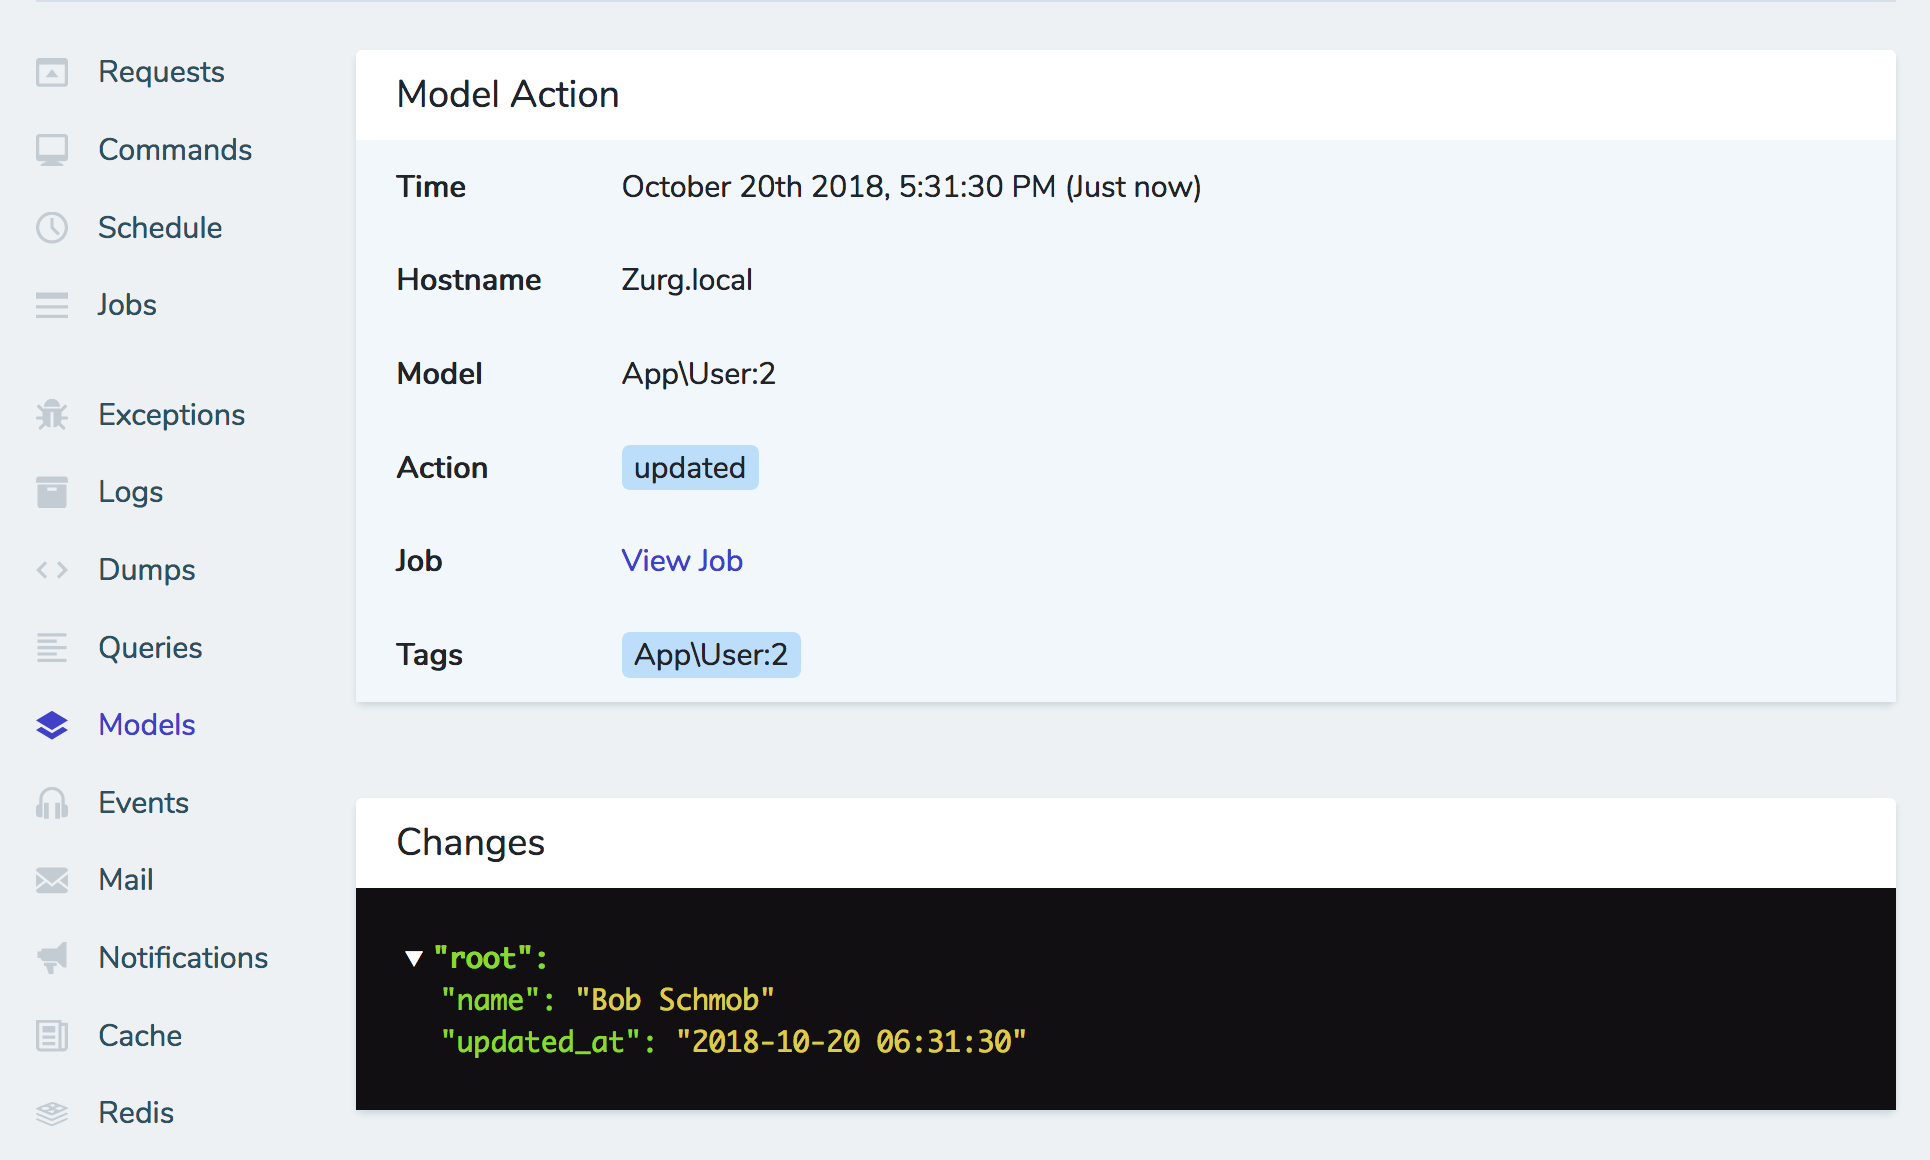
You can see create, update, delete events; shows the changes that were made, etc.
Events

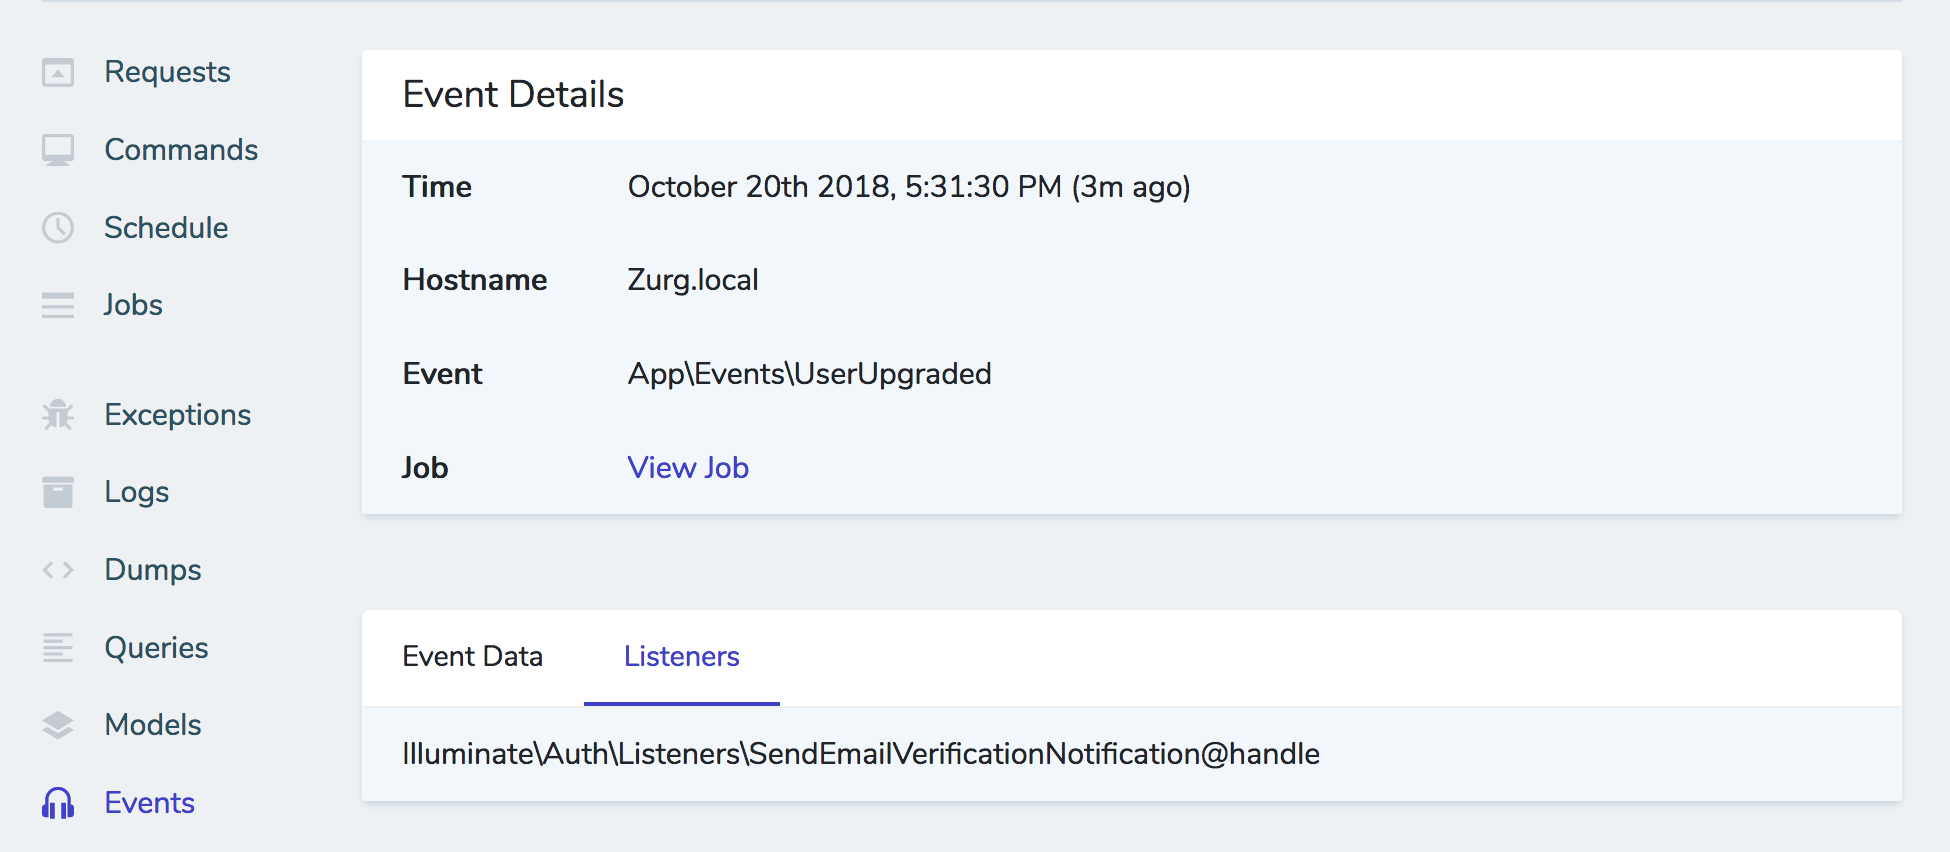
Shows a list of all your events. You can see which events were broadcast with a tag; see a list of all listeners and dig into which called.

Shows a list of all emails that were sent; who the recipients are; when it happened; whether it's queued and then when the queue kicks it out. Can see the email subject, and when you dig into it you also see a preview of the email like MailTrap.
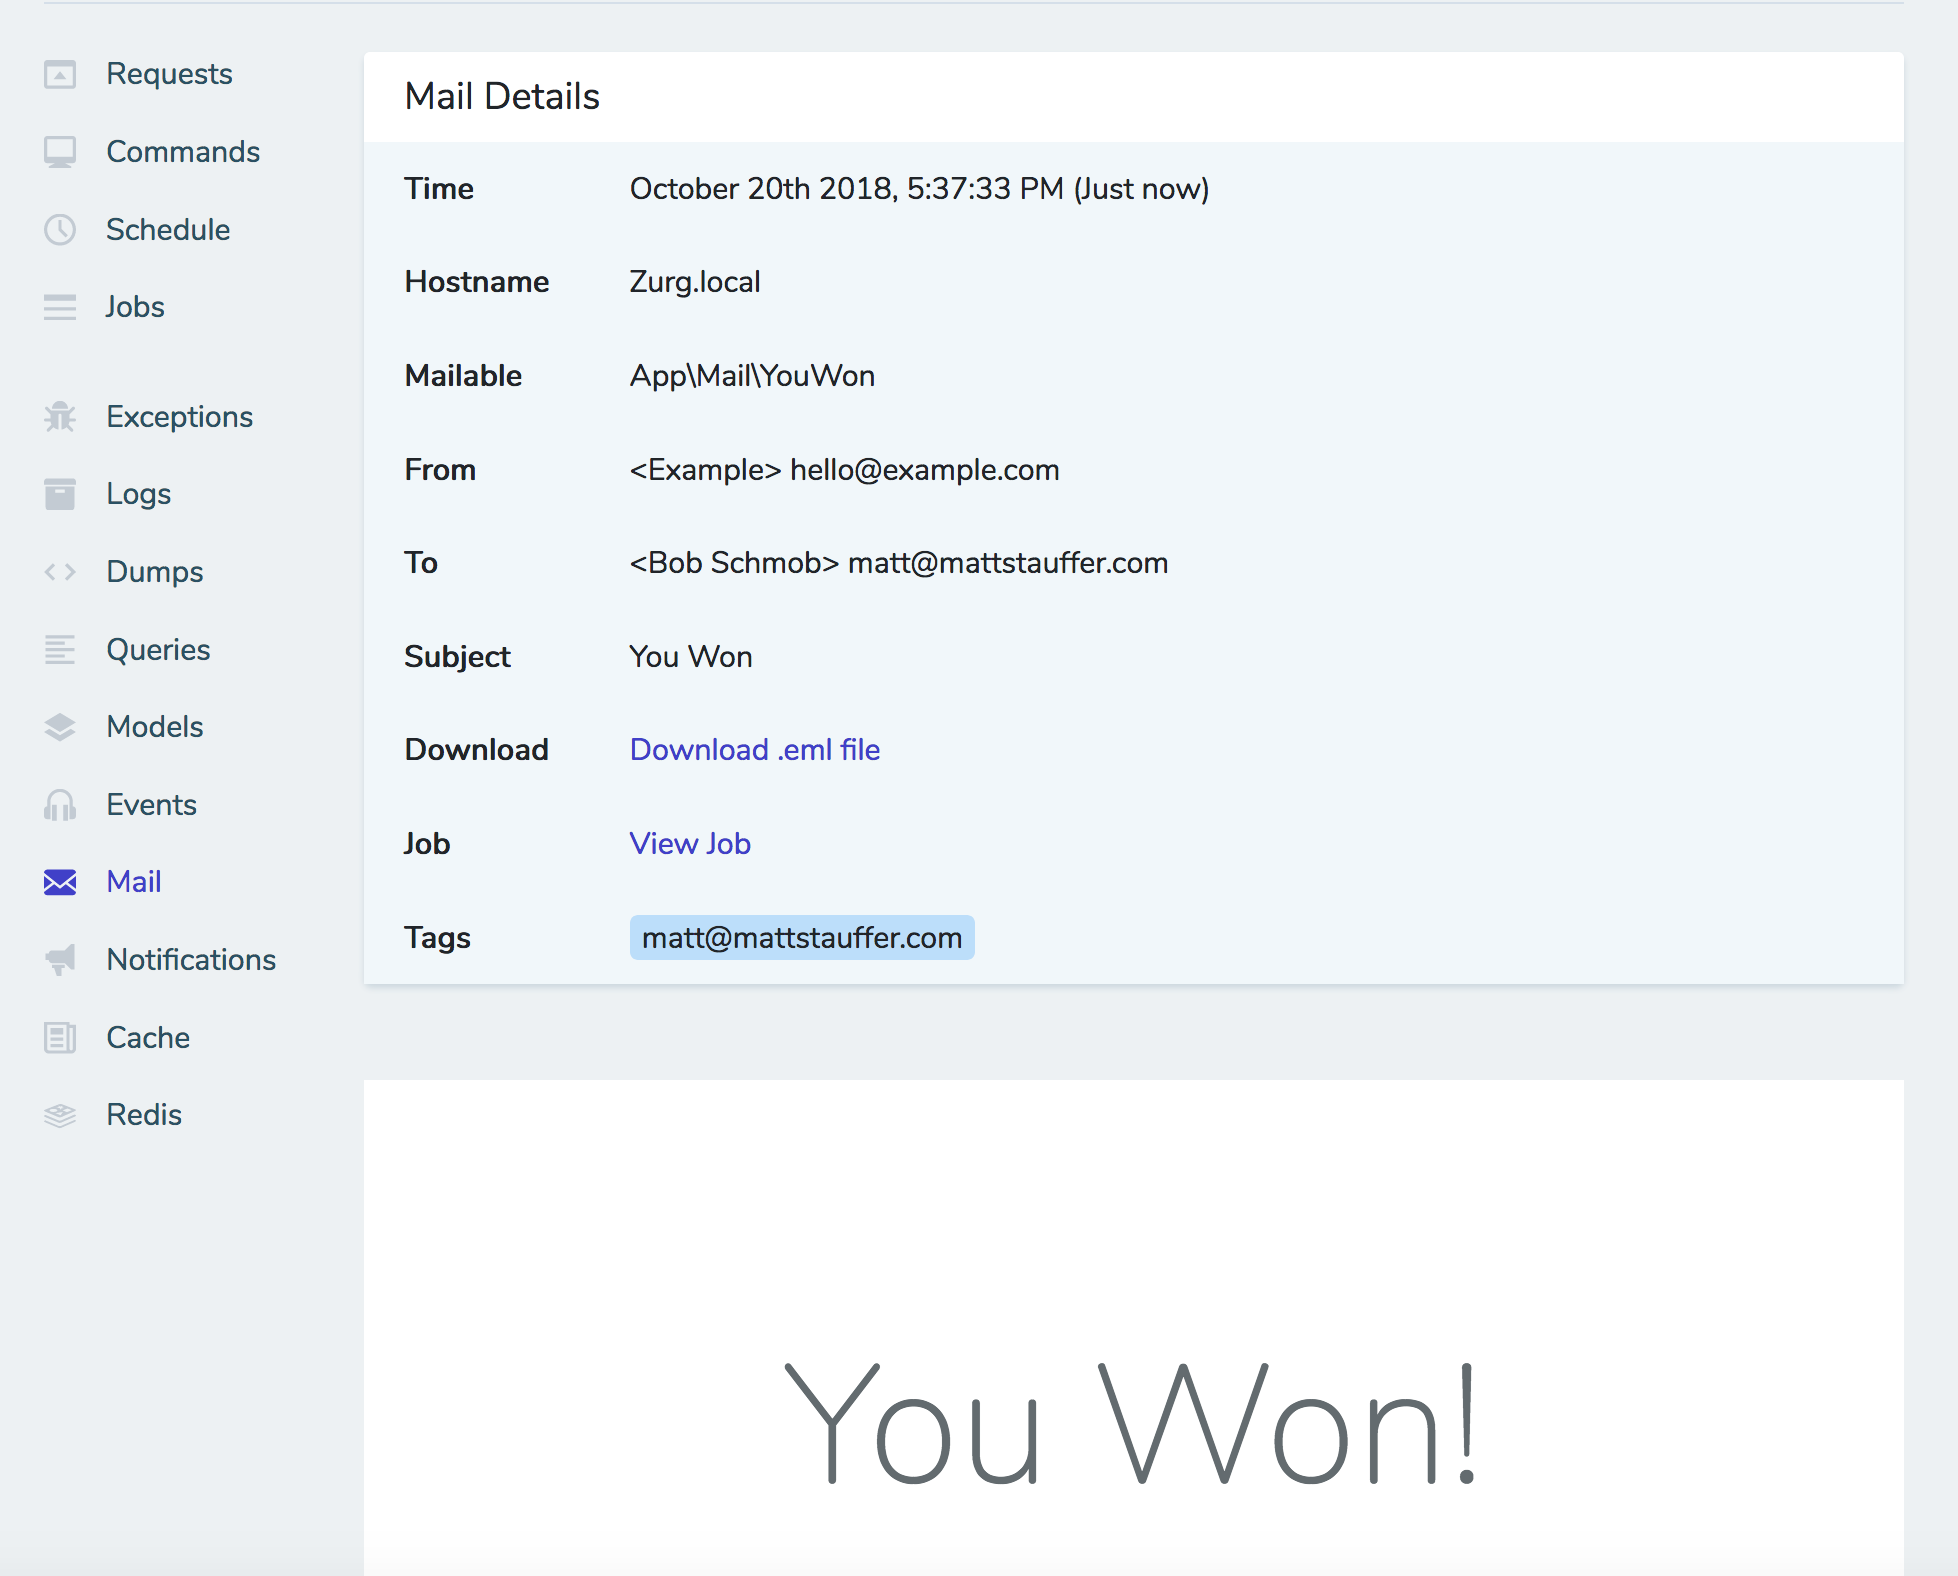
Can even download the raw .eml file and open it in your client of choice.
Notifications

Shows all notifications, what type they were, etc.
No previews since some notifications aren't preview-able, but if it's a mail notification you'll also see it there.
If notification was queued, you can also see it under the Jobs section on the request. Lots of angles to get much of this data.
Cache
Shows cache hits and misses abd updates etc.
Shows the key, the data, when it expires, can see the request that triggered it and also on the request page you can see all the cache hits/misses for taht request

Redis
Similar to cache
How long they took, when it happened, which request initiated, etc.
Authenticated user
Get info about the authenticated user on any entry on any tab

Authorization
Can have a list of emails in telescope service provider who can access it in production
Or use the viewTelescope gate to define whether a given user can access it
Filtering
You may not want to store everything that happens in produciton, so you can , in your Telescope service provider, run Telescope::filter(function ($entry)).`
default filter:
function ($entry) {
    if (local) { return true; }

    return $entry->isReportableException ||
        $entry->isfailedJob() ||
        $entry->isScheduledTask() ||
        $entry->hasMonitoredTag();
}
But you can modify this if you want.
Monitored tags:
Go into the radar button and say monitor a tag. You can say monitor Auth:1 in the UI.
In prod doesn't log requests, but if you monitor for example Auth:1 you now see all of their requests logged until you un-monitor it.
NOTE: Horizon and Telescope play nicely together, if you're using Redis queues.
Prune
Schedule job prunes stale entries from Telescope. Can run nightly if you want to delete stuff older than __ hours.
Also a setting in config/telescope
Can enable or disable any of the watchers. E.g. Watchers\CacheWatcher::class can be disabled.
Also a TELESCOPE_LIMIT which is 100 by default; means keep 100 queries at a time, 100 Redis, etc. LOTS of this is configurable by env.
Miscellaneous
Telescope can run locally and on production and has built-in authorization and tools for protecting private data. It provides access to similar data from multiple different angles, has a bevy of configuration options, and allows for robust tagging and filtering.
Consider putting it on a separate database.
Taylor mentioned on Twitter later you can add filters to ensure private data doesn't get logged.
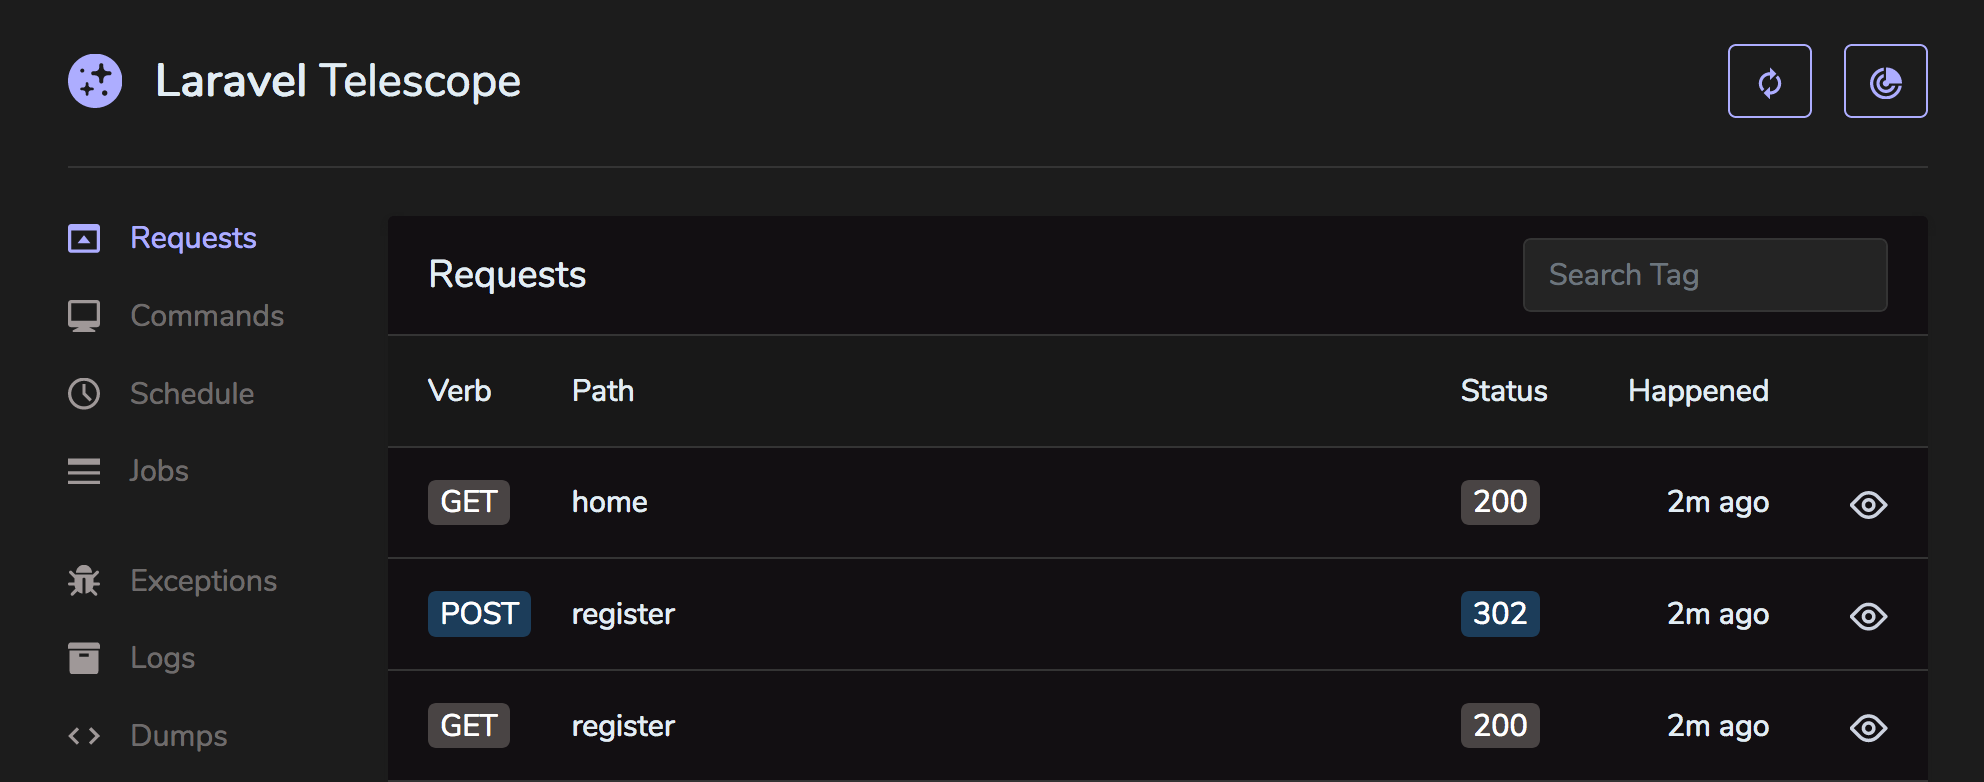
Has a dark mode that you enable with Telescope::night() (probably in a service provider somewhere?)
Q&A:
- Where is data stored? Behind a StorageRepository interface; ships with Database but working on Redis. But you can implement it with anything you want. Only 6-7 methods on the interface.
- How much data is it storing? Not a ton because production discards almost everything, and with prune, you're only keeping 100 at a time.
- Can we get notifications to Slack? We are working on it.
- Can I quit Bugsnag/etc.? Probably don't. It's simpler and slimmer and not meant to be this sort of full and robust situation. Be careful.
- Can we filter by timestamp? Not yet but it is open source :)
- What impact does it have on bootstrap time? Only one query executed every time. On production it's often not inserting anything at all. You can also disable watchers you're not interested in.
- Can we inspect multiple applications in one UI? Yes; just point them to log their info in the same database and then consider tagging/filtering so you can differentiate when needed.
- What versions of Laravel is it compatible with? 5.7.7+.
Comments? I'm @stauffermatt on Twitter
Tags: laravel • discoverability • Telescope


